
Staking plan software put through 500 test bets
The Staking Machine is a Windows program that answers one question. If you had bet different amounts on the same matches, would you have more money today?
A year costs £40. Our Staking Machine review tests one claim from its own front page. The claim: this program will keep you out of the 90 percent who lose.

Pros
- 50 staking plans on the same bets, one click
- No betting account needed
- Shows edge, break-even rate and p-value
- Free version ran our full 500 bet test
Cons
- Shows profit for a bank marked empty
- Totals of minus 347 and minus 493 from 100
- Selection Hunter: Britain and Ireland only
- Version 7 licences stopped working
Staking words you need first
If you are new to betting, five words explain everything below.
Odds are the price of a bet. Odds of 3.00 mean that £10 comes back as £30 when you win, so you gain £20.
Stake is the amount you put on one bet. Bank, also called your bankroll or betting bank, is all the money you have set aside for betting.
Strike rate is how often your bets win. Twenty wins out of a hundred bets is a strike rate of 20 percent.
Staking plan is your rule for choosing the stake. Betting the same amount every time is called level stakes, or flat staking. Betting a fixed share of your bank is percentage staking. Others raise the stake after a loss, hoping to win the lost money back. The famous version of that idea is the Martingale, where you double after every loss.
That last idea has a name in this program: recovery. Fibonacci, Dalembert (often written D'Alembert), Labouchere, Retirement and target profit staking are all versions of it. Keep them in mind, because they cause most of what follows.
One list of bets, fifty ways to stake them
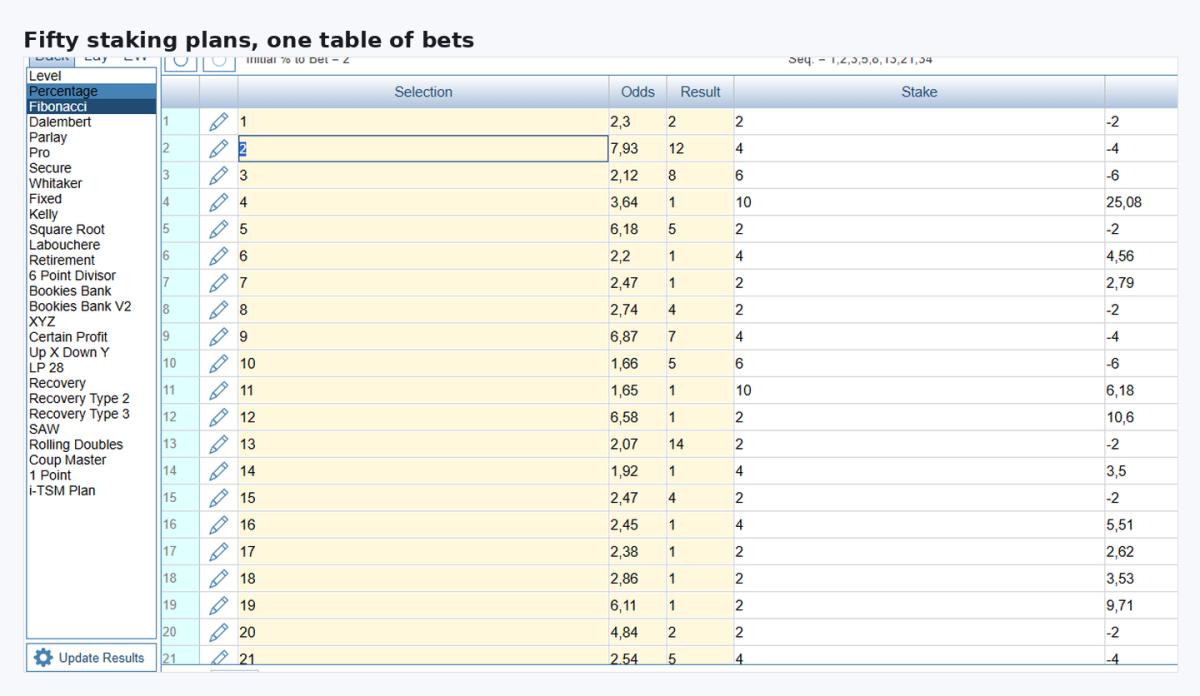
Two things fill the screen. In the middle sits a table of your bets. Each row shows the odds, the result, the stake and the money left. On the left runs a column of about fifty names. Level, Percentage, Fibonacci, Dalembert, Kelly, Retirement, Bookies Bank, three types of Recovery, and more.
Click a name and every row is calculated again. Your bets stay the same. Only the stakes change, and so does the money you end with.
Most bettors argue about staking with no evidence. This program turns the argument into a number.
Strike rate, break-even point and edge
Under the table sits a panel called Quick Stats. Two lines in it matter more than the rest.
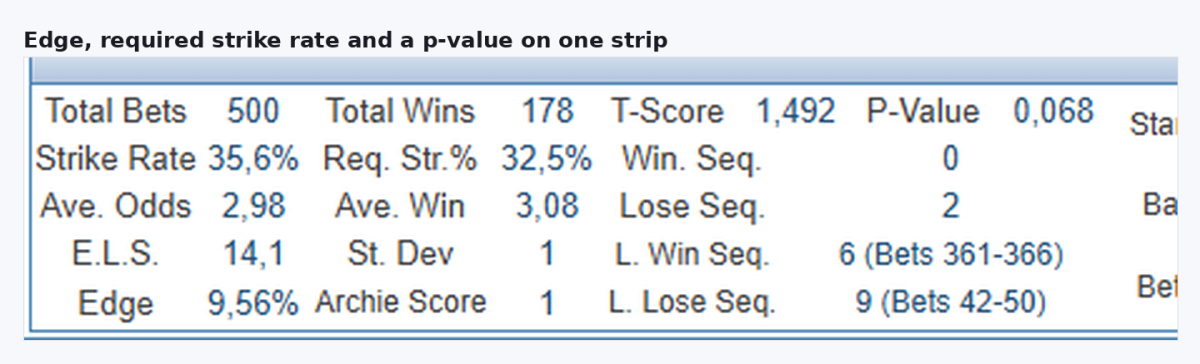
Strike Rate is how often your bets won. Req. Str.% is how often they needed to win for you to end level.
The sum behind it is simple. Take 100 and divide it by your odds. At odds of 3.00 you need to win 33.3 percent of the time.
One detail here can confuse you. TSM divides by the average odds of your winning bets, not by the average odds of every bet. In our winning history the average of all odds was 2.98. That points to 33.6 percent, but the screen showed 32.5 percent. The reason is the winners in that history sat at 3.08 on average. Use the figure on the screen, but know where it comes from.
Win more often than that and your picks are good. Win less often and they are not. TSM prints the gap as Edge.
Edge is not your profit. It compares two strike rates. An Edge of 10 percent means you won 10 percent more often than you needed to. Our good bettor had an Edge of 9.56 percent. On flat staking that history turned 1,000 units of stakes into 58 units of profit. Profit against money staked is called yield, or ROI, and here it was nearer 6 percent.
No staking plan can move those two lines. They come from your picks, and staking only decides how much money rides on each one.
How we tested TSM on 500 bets
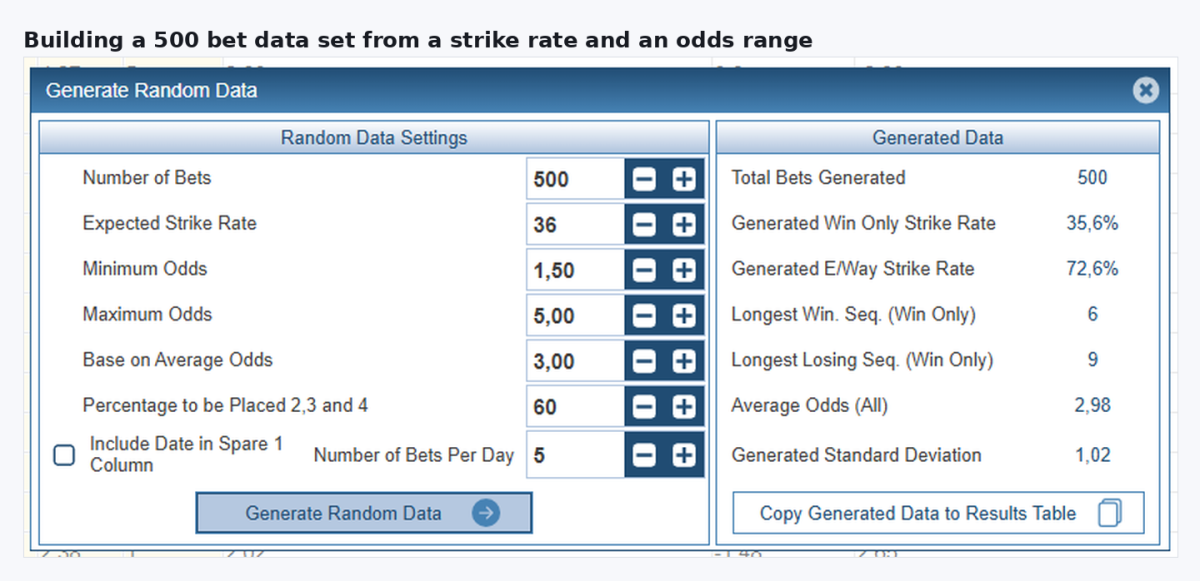
Running old results through a new set of rules is called backtesting, and it is what this software does. TSM can also invent the results for you. Give it a number of bets, a strike rate and a range of odds. A sample betting history appears in one second.
We built two histories.
The first belongs to a good bettor: 500 bets, strike rate 35.6 percent, average odds 2.98, break-even point 32.5 percent. Edge plus 9.56 percent. Very few real bettors sit that far above the break-even line.
The second belongs to an ordinary one: 500 bets, strike rate 32 percent, average odds 2.96, break-even point 33.7 percent. Edge minus 4.99 percent. This is what most betting looks like.
Seven plans were then clicked on each history, with the bets left alone. Every run started with a bank of 100 units and a first stake of 2 percent.
No plan saved the losing bettor
The losing history first. Each row shows the money left at the end, from a starting bank of 100.
| Staking plan | Money left | Bank emptied |
|---|---|---|
| Percentage | 62.56 | no |
| Level | 18.62 | no |
| Recovery | 11.36 | no |
| Retirement | 10.43 | yes, bet 398 |
| Bookies Bank | 0.25 | yes, bet 195 |
| Dalembert | −347.47 | yes, bet 56 |
| Fibonacci | −493.24 | yes, bet 52 |
Every plan lost money. The best of them kept 62 units of the 100. That plan simply bets a fixed share of what is left. Four plans out of seven took the bank to zero before the 500 bets were finished.
So the front page claim fails inside the vendor's own program. Staking cannot fix bad picks. It decides how quickly the money disappears, and nothing else.
Not one of the seven plans made the losing bettor profitable. The best of them still lost 37 units out of every 100.
The best plan on good bets was the worst on bad ones
Same seven plans, now on the history of the good bettor.
| Staking plan | Money left | Bank emptied |
|---|---|---|
| Dalembert | 307.79 | no |
| Fibonacci | 251.28 | yes, bet 49 |
| Bookies Bank | 179.55 | no |
| Level | 158.64 | no |
| Recovery | 152.16 | no |
| Retirement | 146.03 | no |
| Percentage | 126.44 | no |
Put the two tables next to each other and the order flips over. Dalembert tripled the money of the good bettor and finished the losing one at minus 347. Percentage finished last for the good bettor and first for the losing one.
The two biggest totals came from plans that raise the stake after a loss: Dalembert and Fibonacci. Raising the stake pays off while you are winning overall. The same two plans finished the losing history at minus 347 and minus 493.
One name in the table is quieter than it sounds. The plan called Recovery is a mild version of the idea. It finished below plain level stakes on both histories.
Your picks will stop being good at some point. A tipster goes cold. A bookmaker cuts your limits. A league changes and your system stops working. TSM sells the one-click comparison as its main feature. That feature points a beginner at the riskiest plan on the list.
The plan that tops the table in your good months empties your bank in the bad ones.
Fibonacci showed a profit after the money was gone
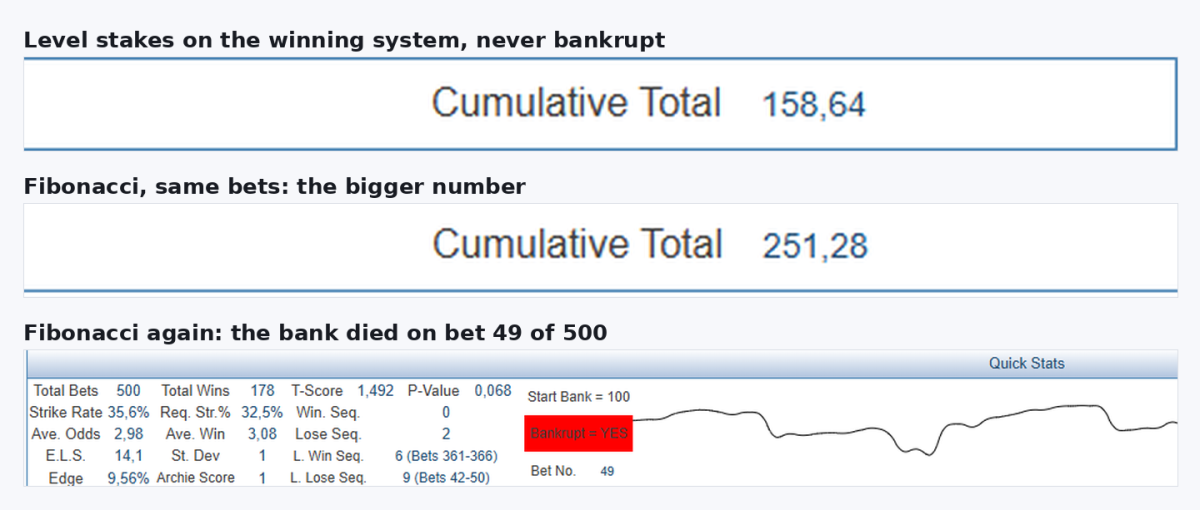
Fibonacci on the winning history is worth a second look. The corner of the screen says 251.28, which beats flat staking. A red box in Quick Stats says Bankrupt = YES at bet 49.
Both cannot be true. The bank was empty after 49 bets of 500. For another 451 bets the program staked money that was not there.
One screen shows 251.28 in profit. The red box beside it says the money ran out on bet 49.
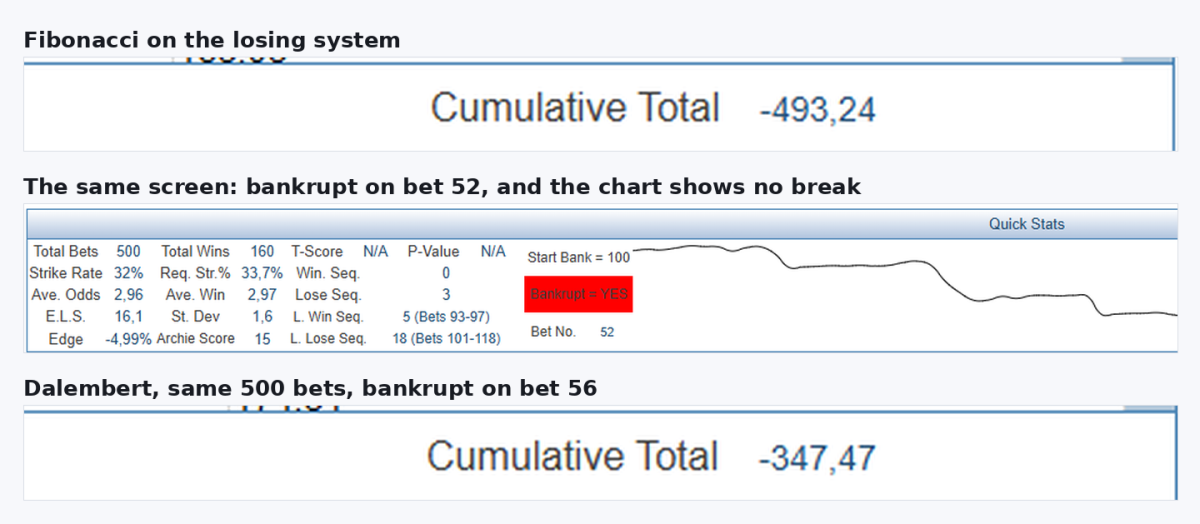
On the losing history the same fault runs the other way. Fibonacci ends on minus 493 from a bank of 100. Nobody can lose more than they own. Dalembert ends on minus 347. Retirement goes bankrupt at bet 398 and still finishes above zero.
The drop from your highest bank to your lowest is called drawdown. The chance of losing everything is called risk of ruin. Recovery plans make both of them much bigger, which is the whole story of these two tables.
Credit where it is due: the red box exists, and it is the one honest signal on the screen. The big number in the corner ignores it, and so does the graph. On the losing history the line slides down smoothly, with no mark at bet 52. It looks as if the money never ran out. A beginner comparing plans by the big number will pick a plan that was already dead.
Two numbers that say 500 bets prove nothing
Quick Stats also holds T-Score and P-Value. Together they measure statistical significance, which answers a question every bettor should ask: could these results be luck?
Our good bettor won about 10 percent more often than break-even, across 500 bets. TSM gave that history a P-Value of 0.068. Read it like this. A person with no skill would do this well, or better, about 7 times in 100 tries. Scientists usually call a result real below 5 times in 100, so this one does not get there.
The throwaway history we made first, with a silly edge near 50 percent, came out at 0. On the losing history both fields showed N/A.
Sample size is the reason. Short term swings, which bettors call variance, can look exactly like skill for hundreds of bets. Only the long run separates them, and 500 bets is not the long run.
Very little betting software will tell you that your winning record might be an accident. This one does, on the same screen as the profit.
An edge near 10 percent across 500 bets still fails the usual test for skill.
The free version of TSM and its limits
Ten bets is the limit of the free version, according to the website. Our test ran on the free download, and the bet generator built 500 rows that every plan calculated in full.
Where the ten bet limit does bite, we cannot say. Loading a saved file was never tried on the free copy, and the vendor does not spell out the difference.
The whole experiment above therefore cost nothing. Try that before you pay, because most betting software gives away far less.
TSMapp, the browser version, has a demo login with saving switched off. Paying lifts the limits to 100,000 rows on the desktop and 50,000 in the browser.
One tool we did not test is the Monte Carlo simulation. It shuffles your bets thousands of times and shows how differently the same results could have landed. Data can also arrive from a spreadsheet. That runs into the same ten bet question as any other loaded file.
Price, cancelling, and the version that disappeared
Crystal Software has sold TSM since 2006. Version 8 arrived in December of 2023 and moved the product to a subscription.
People who had bought version 7 outright lost it. That version can no longer be downloaded or registered, and their permanent licence buys nothing today.
A licence sold as permanent stopped working when the next version arrived.
Six months costs £25 and a year costs £40, through PayPal or Stripe. Payment repeats automatically. Cancel whenever you like and the software keeps working until the paid period runs out. One subscription covers two Windows computers plus the browser version.
TSM is not a betting bot
Several download sites describe TSM as software that places bets for you. That is wrong.
Automation lives in a different product. The same company sells The Bet Machine. It takes selections and passes them to a third program called Gruss Betting Assistant. Gruss is the one that places bets, on the Betfair or Betdaq exchange.
Count the bill for that chain. You need a TSM subscription, a Bet Machine subscription, a Gruss subscription for Betfair, and an exchange account. Exchanges are closed in most countries, so for many readers the chain stops at the first link. On its own, TSM never touches a bookmaker.
Two more limits are worth knowing. Selection Hunter, the tool for building your own systems, only covers horse racing in Britain and Ireland plus British greyhounds. The desktop program needs Windows, although the browser version works anywhere.
Where the £40 is worth spending
Anyone who already records their bets will get real value from this program. It reads a file from Excel or a CSV export. Out come your real edge, your break-even strike rate and your expected losing sequence. That last one is the longest run of losses to plan for. It also says whether your betting system proves anything yet. Selection Hunter, the built-in system builder, adds filters on top of that. Our bet tracker guide covers the apps that produce that file.
Anyone hunting for a staking plan that wins should save the £40. Our two tables show there is no such plan. The ones that look strongest are the ones that empty a bank. For the maths behind stake size, read our Kelly criterion guide first.
TSM is cheap, quick and more honest than its own advertising. That is a strange thing to write about betting software. Use it to measure your betting. Nothing in it will improve your picks, and its own numbers say so.
Frequently asked questions
Does The Staking Machine work with any bookmaker?
Can TSM run on a Mac?
How many computers does one subscription cover?
Can a staking plan turn a losing bettor into a winning one?