
FotMob: Opta's xG, one shot at a time
FotMob is a football-only live score app that puts expected goals, or xG, on every shot: a number for how often a chance like that is scored. The data is Opta's. Our FotMob review covers what that gives a bettor, where it stops, and one match checked against SofaScore.

Pros
- xG and xGOT on every shot.
- Same Opta numbers TV uses.
- Player traits in percentiles.
- Season shot map per player.
Cons
- No xG in small competitions.
- One bookmaker, set by country.
- No download, no API, no scraping.
- Ads unless you pay.
FotMob does not build its own xG. It prints Opta's, the same figures the broadcasters use, on every shot in the match, and it does it for free.
What FotMob is for
Most people install the FotMob app for the score and the notifications, and the About page counts them: more than 100 million downloads, 20 million monthly users, 500 competitions. The store reviews are about speed. And about ads.
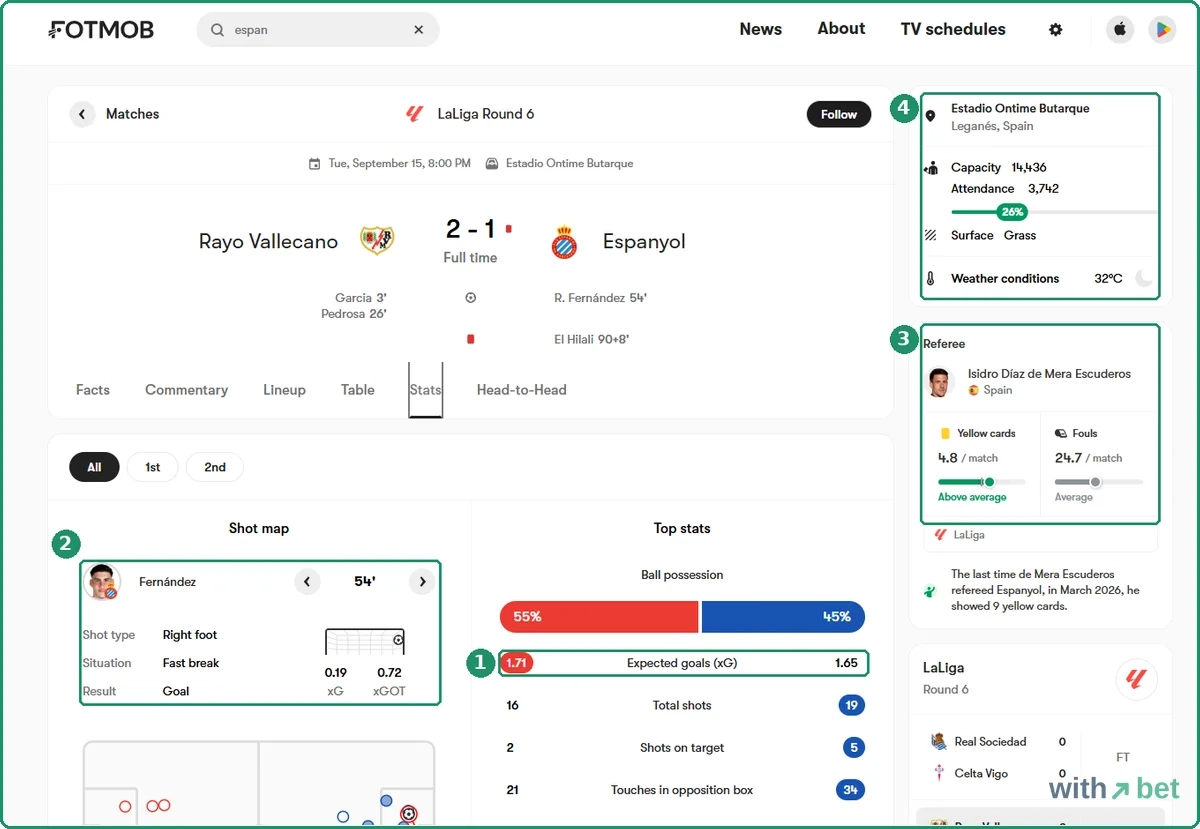
A bettor opens the Stats tab. On a La Liga match it holds possession, xG, shots, touches in the box, big chances (clear shots at goal, the kind you expect to go in), passes, then blocks for xG, shots, passes, defence, duels (one-on-one contests for the ball), discipline and attacking zones (which side of the pitch each team attacked down).
The shot map on the left lets you step through every shot with the arrows and read its xG and xGOT, expected goals on target, a second number for how good the shot itself was. The xG block under it splits the total into open play, set play (corners and free kicks) and non-penalty xG, the total with penalties taken out. A side column adds the stadium, the attendance, the weather and the referee's card rate. Understat has none of that side column, and SofaScore has some of it.
Why would that matter before a bet? Because a score is one number and a match has thirty or forty shots and chances behind it. Rayo Vallecano beat Espanyol 2-1 on 15 September.
The Stats tab says Espanyol had 19 shots to 16, five on target to two, 34 touches in the box to 21, and an xG of 1.65 to 1.71. Close to even on chances. Rayo scored in the 3rd and 26th minutes; Espanyol's reply was a fast break in the 54th, a 0.19 chance turned into a 0.72 shot, and the map shows all three.
Who runs FotMob: Bergen, 2004
The footer says © 2026 FotMob and links a Terms of use, a cookie policy, a privacy policy and a Norwegian transparency act statement. Four documents. Understat has one email address.
The About page tells the origin. In 2004 Christer Nordvik, on honeymoon in Thailand, could not find a way to follow matches at home. He went back to Bergen and built one with his brother Tommy. The company is FotMob AS, Media City Bergen, Lars Hilles gate 30, and it calls itself independent, with staff in Norway, Mexico, Germany and the UK.
Is FotMob legit? A street address, two named founders, a transparency statement required by Norwegian law, and a listing with 100 million downloads. The money comes from advertising, an ad-free upgrade in the app, and a bookmaker partner in the countries where that is allowed.
How to use FotMob: seven clicks
The steps are for the FotMob website on a desktop; we did not open the football app for this review, and the store screenshots show the same tab names under the score.
- Type a team into the search box at the top. Pick the club.
- Pick the club, or a match straight from the search results, and open a finished match.
- The match page opens on Facts. The tabs are Facts, Commentary, Lineup, Table, Stats and Head-to-Head. Click Stats.
- Buttons All, 1st and 2nd switch the period.
- The left column is the Shot map. Use the arrows next to the player's name to step through the shots; each one shows shot type, situation, result, xG and xGOT.
- The right column is Top stats, then the xG block, Shots, Passes, Defense, Duels, Discipline and Attacking zones. Scroll.
- Click a player on the Lineup tab, or search a name. The player page holds traits, transfer value, a match log, a heatmap, a season shot map and a ranked performance list.
Seven clicks from the home page to the xG of one shot.
FotMob leagues with xG, and without
Where we found it: the Champions League, La Liga, the Bundesliga (on a player page), and in August the English Championship, Major League Soccer and the Eredivisie. Where we did not: a Bolivian top-flight match in August had possession, shots, shots on target, big chances, passes and corners, and no expected goals anywhere on the page. In September a Bolivian cup match we looked for was not on the site at all.
How many competitions is that? FotMob's own release note on live xG, from when it launched the feature, said 23. The figure is old, and the site does not publish a current list.
Our reading after two rounds of checking: the big European leagues, the second tier in England, the top American league and the Dutch league carry FotMob xG. The smaller national leagues carry counted events and no model. SofaScore's line sits in the same place, and the next section says why.
xG on every shot: the shot map
Click any shot on the map and a card opens. Fernández, 54th minute, right foot, fast break, goal. xG 0.19, xGOT 0.72.
xG, 0.19, is the chance before the ball was kicked: a fast break from that angle goes in about one time in five. xGOT, 0.72, is the shot after it was struck, with its placement counted, and a shot on that line into that corner goes in about seven times in ten. One-in-five became seven-in-ten. That is finishing.
Now the other way round. A tap-in from three metres that goes wide? xG 0.7, and no xGOT at all, because only shots on target get one. A hopeful shot from thirty metres that hits the top corner: xG 0.03, xGOT 0.9.
Understat gives you the first number. SofaScore gives both, as match totals. FotMob gives both on every shot, which is the only way to see whether a team's goals came from good chances or from good finishing, and those two things do not last equally long.
FotMob and Opta: one match, three sites
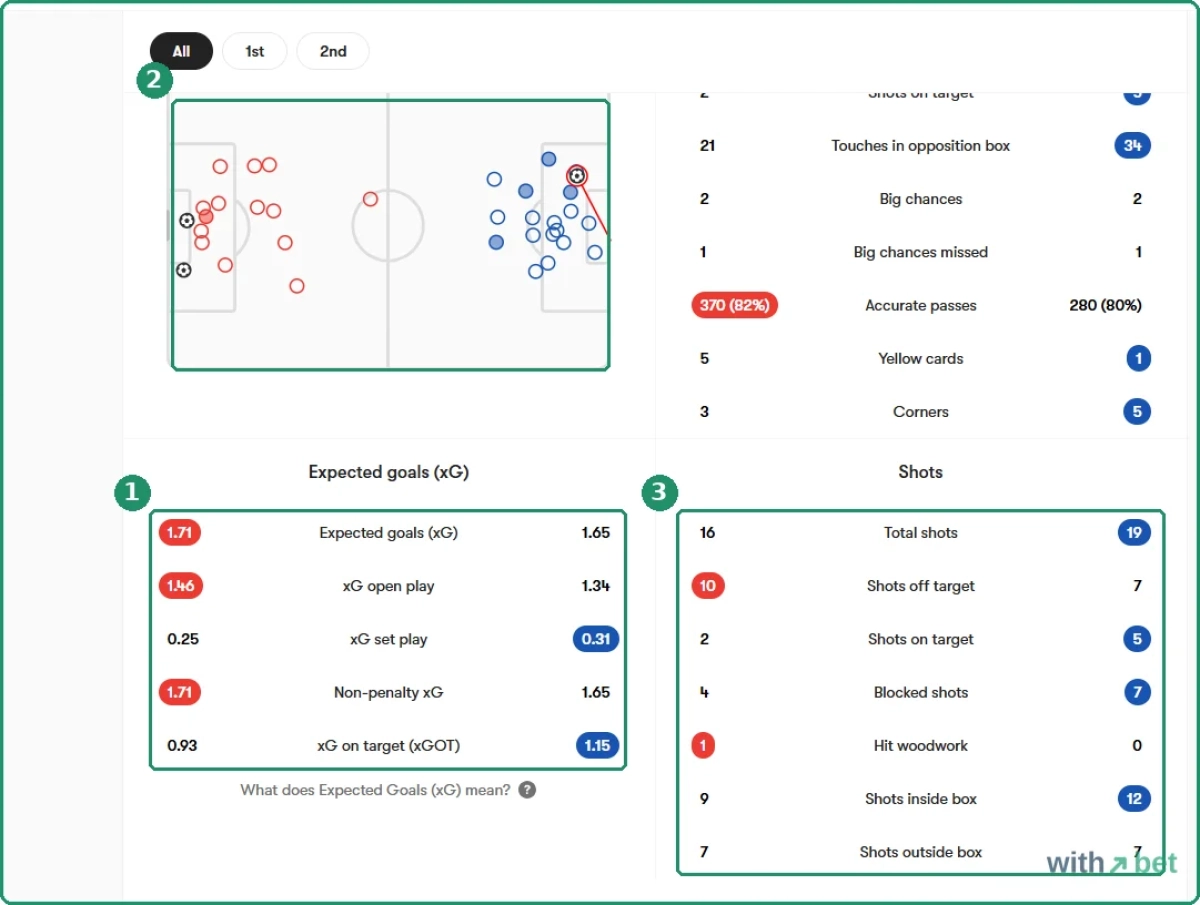
We opened Rayo Vallecano 2-1 Espanyol on all three free sources. FotMob: Rayo xG 1.71, Espanyol 1.65, xGOT 0.93 and 1.15, big chances 2 and 2. SofaScore: 1.71, 1.65, 0.93, 1.15, 2 and 2. Identical to the hundredth. Understat: Rayo 1.83 from the same 16 shots.
So the two apps do not run two models; they show the same supplier's figures. Which supplier? A FotMob press release from May 2026 names it: match data “powered in real-time by Opta”, the feed FBref carried until January and the one the Premier League broadcasts quote.
When a pundit says “an xG of 2.4”, it is usually this model. For a bettor that answers a practical question: FotMob and SofaScore are interchangeable on the number, so pick by the screen you prefer. Understat is a second opinion, 0.12 higher on this match, from a model trained differently, and the two figures should not be averaged.
Rayo Vallecano's xG on 15 September: 1.71 on FotMob, 1.71 on SofaScore, 1.83 on Understat. Two of those are the same Opta figure. The third is a different model.
Reading one match: 19 shots, one goal
The full Stats tab for Rayo against Espanyol, block by block. Top stats first: possession 55 to 45, xG 1.71 to 1.65, shots 16 to 19, on target 2 to 5. Then touches in the box 21 to 34, big chances 2 to 2, big chances missed 1 to 1. Accurate passes 370 to 280, yellow cards 5 to 1, corners 3 to 5.
Then the detail. Rayo won the ground duels 34 to 20, Espanyol won the aerial ones 18 to 12. Rayo's keeper made three saves, Espanyol's none. Attacking zones: Rayo sent 46 percent of its attacks down one flank, Espanyol 40 percent down the same side of the pitch.
Espanyol had more shots, more on target, more of the ball in the box, and lost. Its one goal carried the highest xGOT of the match; Rayo's two came in the 3rd and 26th minutes.
Which of that helps a bet on Espanyol's next match? The 19 shots and the 34 box touches say the attack works. The one goal from 1.65 xG says the finishing did not, in that match. The referee panel gives the next referee's card rate before you touch a cards market.
A page with this many numbers rewards a question decided in advance; without one, some line will always agree with the bet you had in mind.
FotMob player rating: 300 data points
Every player in a covered match gets a FotMob player rating, and the Team of the Week on a league page is built from them: 9.7 for Demirović and Dembélé after the first Champions League round.
The company says the rating uses more than 300 data points and its own algorithm, and that the highest it has ever given is a 9.9. How the points are weighed? Not published, on FotMob or on SofaScore.
On a player page the ratings line up match by match. Waldemar Anton of Dortmund has 7.6, 7.5, 7.2, 8.7, 7.6, 7.7 and 6.3 in his match log, which also holds games outside the Bundesliga. His Bundesliga average alone is 7.87, from four games and 360 minutes.
A defender at 8.7 after a 3-2 win at Hoffenheim with one assist. The number moves with involvement. A busy defender in a chaotic win rates high; a striker who touched the ball twelve times rates low, even if one touch was a goal.
Player traits: percentiles by position
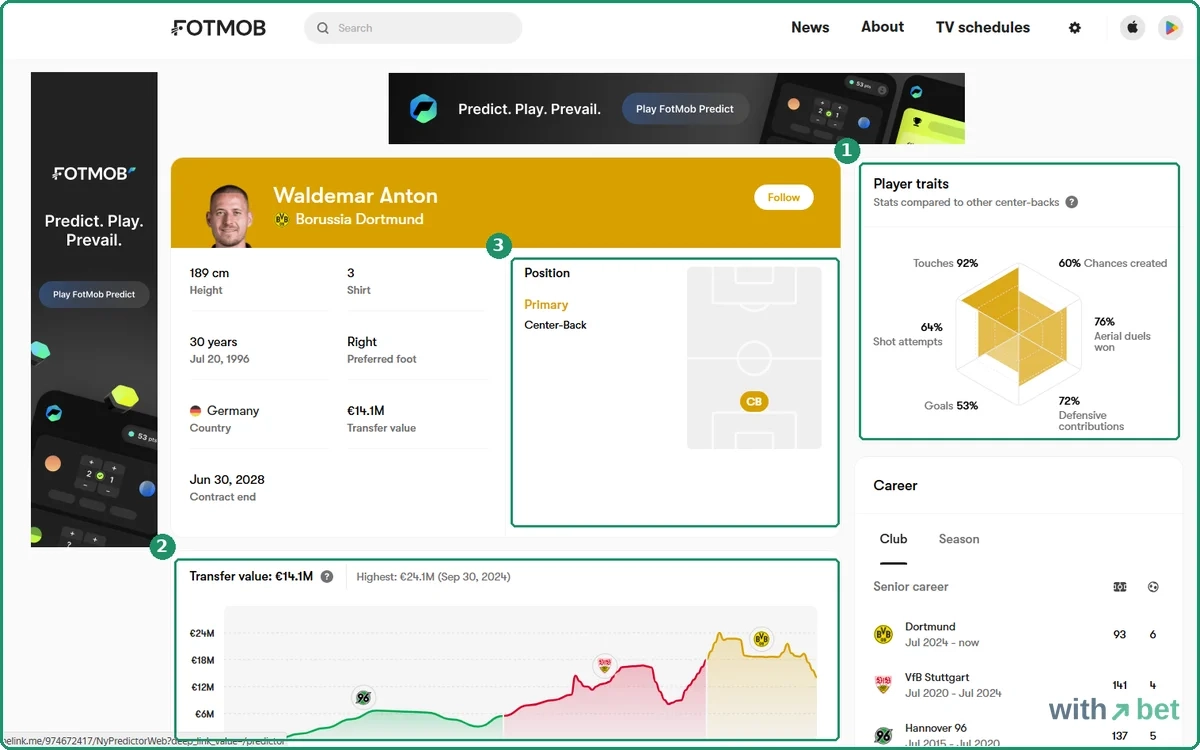
The player page opens with Player traits, a six-point radar with percentages, each one a percentile: the share of players in the same position he beats on that stat. Anton: 92 for touches, 76 for aerial duels won, 72 for defensive contributions, 64 for shot attempts, 60 for chances created, 53 for goals. “Stats compared to other center-backs”, the label says.
So the 92 does not mean he touches the ball 92 times; it means only 8 percent of centre-backs touch it more often per match.
Below, Season performance lists forty lines with a coloured bar for each, green for a high rank, red for a low one. xG 0.02 from one shot. Expected assists 0.15. 222 successful passes at 89.9 percent, 13 interceptions, 39 clearances, 3 clean sheets.
Then xG against while on pitch 4.31, with 2 goals conceded: a defender's xG line, chances worth 4.31 goals allowed in his 360 minutes and 2 of them scored.
Then a transfer value with its history, 14.1 million euros now, a peak of 24.1 million in September 2024, drawn as a line back to 2016 across three clubs. FotMob does not say who computes the value, and it is not a market price, so it works as a form curve and not as a fee.
Season shot map with xG per shot
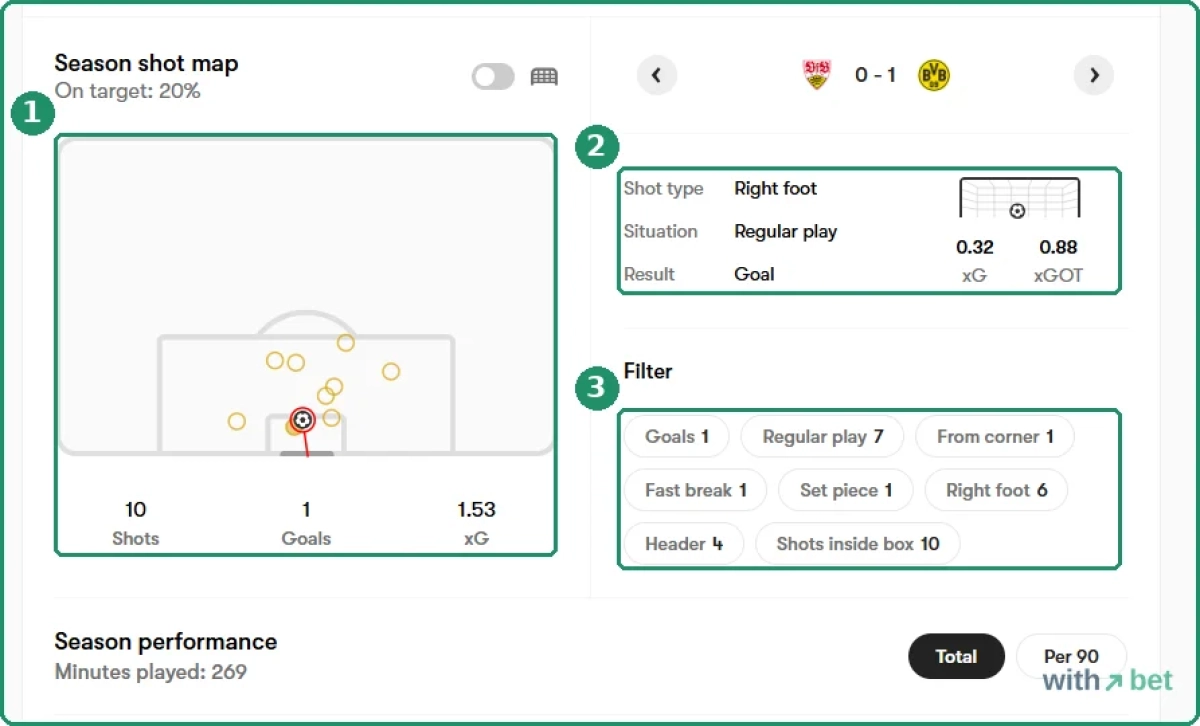
For a striker the section to read is the shot map. Maximilian Beier of Dortmund, four Bundesliga matches, 269 minutes: 10 shots, 1 goal, 1.53 xG, 20 percent on target. Every shot sits on the half-pitch, all ten inside the box, four of them headers. Click one and the card opens. His goal at Stuttgart: right foot, regular play, xG 0.32, xGOT 0.88.
Ten shots for 1.53 xG is about 0.15 a shot, the kind of chance scored one time in seven. One goal from 1.53 is a little under par, and two on target from ten says why. Filters split the map by goals, situation, foot and headers.
Below the map, Season performance ranks each line against players in his position: xG and shots in green, shots on target in orange, xGOT 1.70 above the 1.53 xG, so the shots that did reach the target were good ones. His transfer value, 30.8 million euros against a peak of 42.3 million in June 2026, sits above it all, again with no named source.
Understat gives a season shot map too, and FotMob gives it for leagues Understat does not have. The difference is the archive: Understat keeps every season since 2014/15; FotMob has a season drop-down, and we did not check how far back the shot data goes.
FotMob odds: one bookmaker, by country
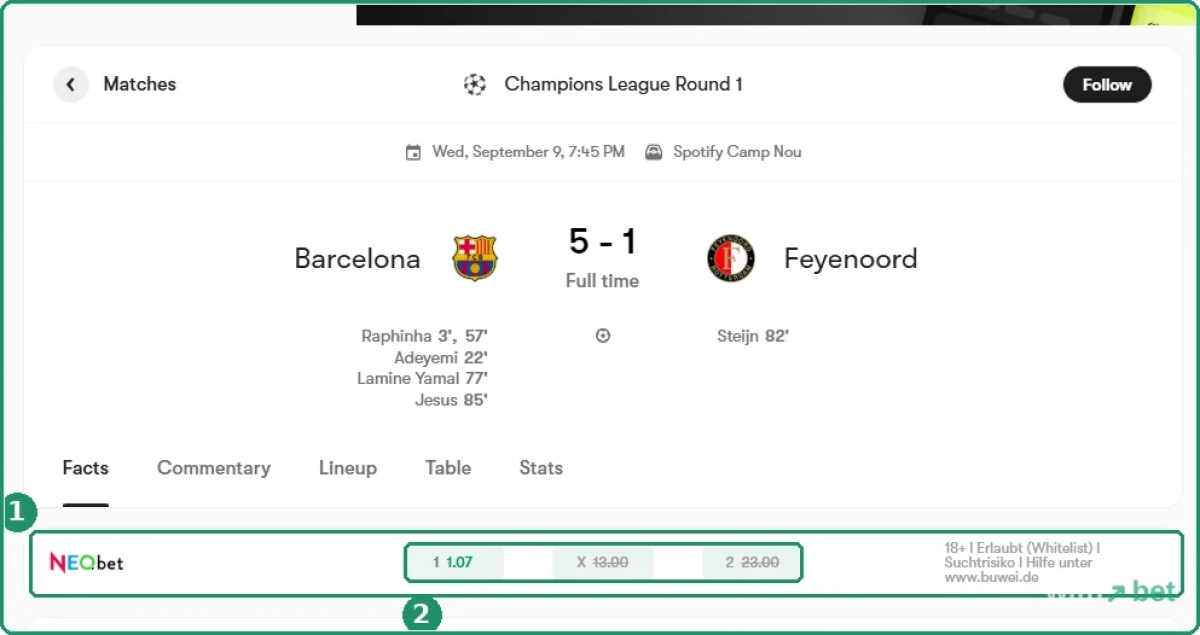
Under the score on the Barcelona 5-1 Feyenoord page sat one row: NEObet, 1 at 1.07, X at 13.00, 2 at 23.00, with an 18+ notice in German and a link to a German help line. One bookmaker, not two as on SofaScore. Which one depends on where you open the site; that row is for readers in Germany. The prices were struck through because the match had finished.
It is a partner placement. Use it to see that a match has been priced and roughly where, not to compare. For the market, an odds comparison site lists twenty books on the same match.
FotMob league pages and Team of the Week
A competition page has Overview, Table, Fixtures, Player stats, Team stats, Seasons and News. The table carries wins, draws, losses, goals, goal difference, points, the last result as a form badge and the next opponent's badge. Next to it, Team of the Week, eleven players with their ratings, round by round.
Team stats and Player stats sort the competition by the counted numbers; we did not check whether xG is among the columns.
No expected points, no xG against in the table itself. For a season table of xG, WhoScored has one on its league pages, with chances for and against, home and away. Understat adds expected points, for its six leagues.
FotMob ads and the ad-free upgrade
The free version carries ads on the site and in the app, and the ads are what most negative reviews are about. Trustpilot's page is largely complaints about a run of Temu placements; one App Store review describes an ad that opened the store on a scroll.
The app sells an ad-free upgrade through the stores, listed under different names by store and country, so a search for FotMob Premium or Remove ads lands on the same thing. We did not open the app for this review and do not print a price: the amount is set per country and changes.
No paid tier with extra statistics appears in the store listings, so everything in this review is in the free version.
FotMob data: no download, no API
Every number here was read off a screen. There is no export button and no public FotMob API. The footer goes one step further than SofaScore: “The use of automatic services (robots, crawler, indexing etc.) as well as other methods for systematic or regular use is not permitted.”
Python packages that pull FotMob data exist, and they run against that sentence. A spreadsheet of xG gets filled by hand.
FotMob vs SofaScore and Understat
FotMob and SofaScore show the same Opta xG, as the Rayo match proved to the hundredth. The differences are around the number. FotMob puts xG and xGOT on every shot; SofaScore gives shot type and zone per shot and the xG only as a total.
FotMob is football only; SofaScore covers 20 sports. SofaScore's lower leagues include pages edited by volunteers; FotMob's small leagues have fewer numbers and no volunteer line. SofaScore sells AI forecasts as Pro; FotMob sells only the removal of ads.
Understat is a different model and a different shape: six leagues, a season table with expected points, an archive to 2014 and a download on every table, none of which FotMob has.
Understat has no xGOT, no per-shot map on the match page, no ratings and no Brazil. A La Liga bettor keeps both open. A Championship bettor has FotMob and SofaScore, and a Bolivian league bettor has a score and the counted events.
FBref carried this same Opta xG until January 2026 and now carries none, so FotMob is where those columns went, one match at a time. Our FBref alternatives page sorts the free sources by which number you need, and the method for turning xG into a price is in the expected goals guide.
Two apps, one Opta feed. FotMob shows it shot by shot, SofaScore shows it as totals with ratings around it. Neither one offers a download.
Five steps before a bet
- Open the last three matches of each team on the Stats tab. If the xG block is missing, the competition is not modelled; read shots and big chances instead.
- Compare xG with goals in each match. A team scoring well above its xG for three matches running is a team the odds may be overrating.
- Step through the shot map. Count the shots above 0.3 xG: those are the real chances. A team with none of them and a total of 1.2 built from twelve long shots was not unlucky.
- On the player page of the main striker, read xG against goals for the season and xGOT against xG. Beier: 1.53 xG, 1 goal, xGOT 1.70. Hot or cold finishing shows there first.
- Take the price from an odds comparison site, not the single row under the score, and turn the xG into a fair price with the xG guide.
What FotMob does not show
No season xG table with expected points: the competition pages sort by xG but do not tell you who is over- or under-performing the table. No archive of seasons for xG that we could confirm; the season drop-down goes back, and we did not check how far the shot data follows it.
No download and no API, with a footer that forbids scraping. No second bookmaker. No sports other than football. And the transfer value on a player page has no named source.
Rating 4.1: the best view of one shot
For a match in a covered competition, FotMob shows more about each shot than any free site we have reviewed: the chance, the shot, the situation, the foot, on a map you can step through. The supplier is the one the broadcasters use.
The player pages add percentile traits and a season shot map, and behind it all is a company with an address, a transparency statement, and nothing to sell except the removal of ads.
A point comes off for the edges, and they are SofaScore's edges too: a model that stops somewhere below the big leagues without FotMob saying where, nothing that can be downloaded, and ads that take up most of the space in the app reviews.
Rating 4.1 out of 5, a tenth above SofaScore, because xG per shot is the number a bettor uses most and FotMob is the only free place to read it. Understat is not rated against either app, since it covers a season table rather than a match.
Frequently asked questions
Is FotMob free?
Where does FotMob get its xG?
Does FotMob have xG for every league?
Does FotMob have an API?
Is FotMob better than SofaScore?
