
Understat: xG, xPTS and six leagues
Understat is a free football stats site built around one number, expected goals. Six leagues, every season since 2014/15, an xG value on every shot, and betting is where most of its readers take the numbers. We used it without an account, and this Understat review is what we found, including one number on the Barcelona page that did not add up.

Pros
- Season xG tables since 2014/15.
- xG for every single shot.
- Home and away splits.
- CSV export on every table.
Cons
- Six leagues, nothing else.
- Own model, not Opta's.
- No company or terms named.
- Two tables disagree on xG.
Six leagues, every season since 2014, every shot with an xG value, and no account. The limit is the six leagues.
What Understat is for, in plain words
A score tells you what happened, not what should have. A team can win 2-0 from two lucky shots. It can lose 0-1 after twenty good ones. Expected goals, xG, gives each shot a number between 0 and 1, the chance that a shot like it ends in a goal, and the team's xG for the match is the sum.
Understat does that for six leagues. The xG stats come four ways: a league table with xG next to the real goals, a team page with the shot breakdown, player stats per 90 with a radar, and a match page with a shot map for both teams.
Why would a bettor care? Because odds follow results, and results lie for a while. A team that has won its last four with less xG than its opponents in each of them is not the team the price says it is. Understat shows that in one table. How to turn the number into a fair price is in our guide to expected goals. This page is about the site.
Six leagues, one model
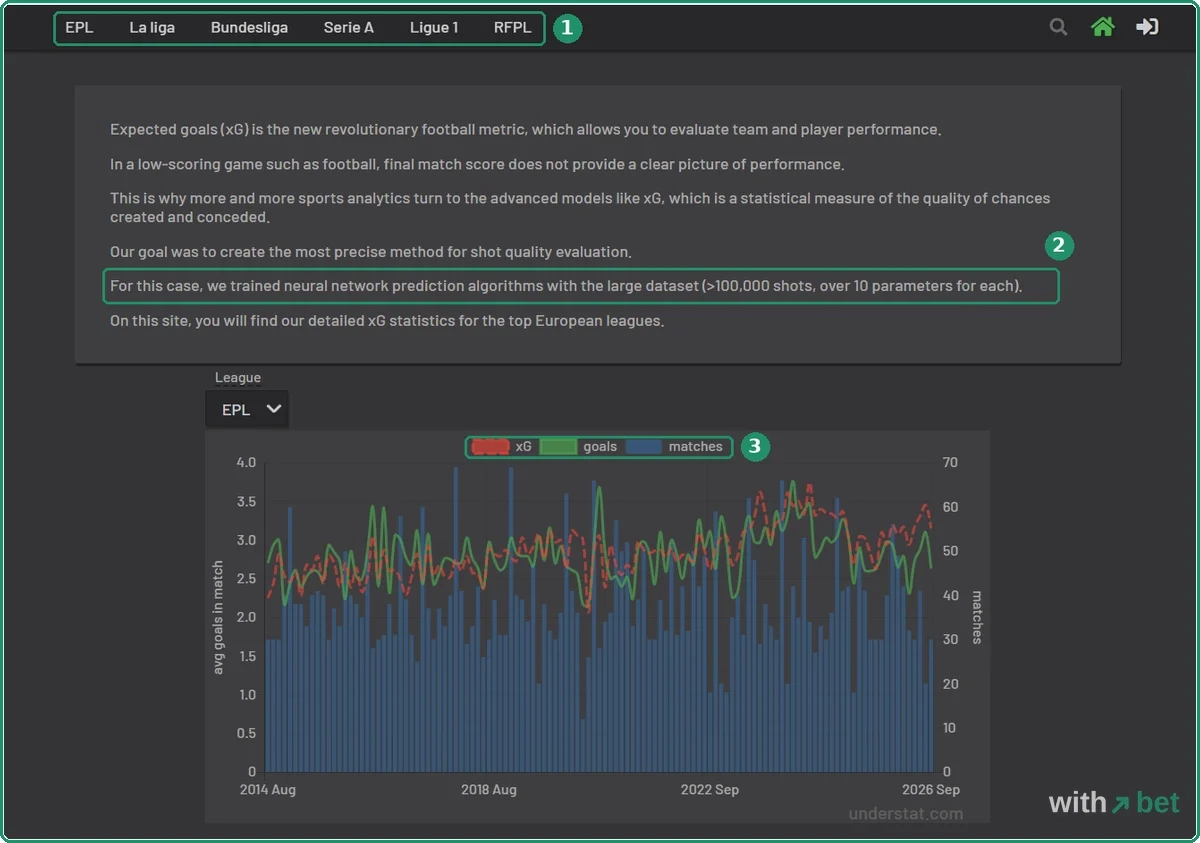
The header lists the Understat leagues: EPL, La Liga, Bundesliga, Serie A, Ligue 1, RFPL. Nothing else. No Champions League, no Championship, no Eredivisie, no cups, no national teams, so a bet outside those six leagues gets no help here.
The model is Understat's own, trained, the home page says, on more than 100,000 shots with over 10 details recorded for each.
It is not Opta data and not StatsBomb data. So the xG you read here will not match the xG in the SofaScore or FotMob app for the same match; one shot can differ by a tenth of a goal between models. Pick one source for a season and stay with it.
The home page also carries a chart of average goals per match since August 2014 with the xG line drawn over it. The two lines cross each other all the way along. Neither stays above the other for long, which is the first thing you want to know about a model before you trust its number for one match.
Who runs Understat: an email and a copyright line
Nobody, as far as understat.com tells you. The footer has the six league links, support@understat.com and a copyright line, © understat 2017-2026, and that is all: no company name, no country, no terms page, no privacy page, no About page. Is Understat legit? The data is real and free, and the people behind it are invisible.
The data starts in August 2014 and the copyright in 2017, so the site opened in 2017 and loaded three seasons of history behind it. Does it matter for a free site with nothing to buy? A little. You cannot check who owns the numbers you read.
Contact is that one address, support@understat.com. No form, no chat, no social links in the footer, no help page. We did not write to it, so we cannot say how fast it answers, or whether it answers at all.

The league table: xG, xGA and xPTS
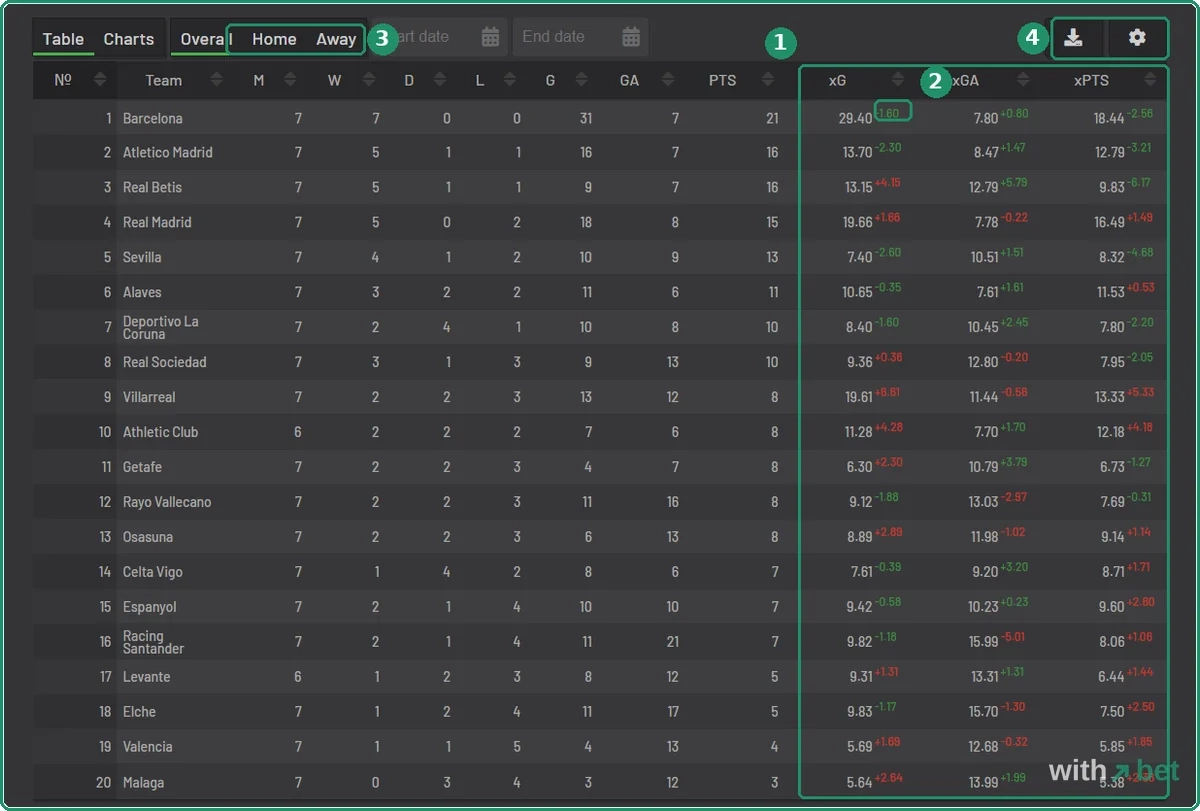
Open a league and you get an xG table that looks like any other until the last three columns. M, W, D, L, G, GA, PTS, then xG, xGA and xPTS. How to read them takes one paragraph.
xG is the goals the team should have scored from the shots it took. xGA is the goals it should have conceded. xPTS is expected points: the points the team would have if every match had ended the way the shots suggested. Understat prints all three next to the real figures.
Take La Liga after seven rounds, the day we looked. Barcelona: 31 goals, xG 29.40, seven wins, 21 points, xPTS 18.44. The champion is scoring a little more than it creates and winning a little more than it should.
Now Real Betis. Five wins and a draw, 16 points, xPTS 9.83. Six points more than its shots have earned, and Villarreal sits ninth with 8 points and an xPTS of 13.33, five points the other way.
After seven matches the real table is five or six points away from the expected one for both teams. That gap is the whole reason to open the site. The odds on their next matches are set by people who read the same table you do, and some of them read only the left half.
The small number next to every figure
Every xG, xGA and xPTS cell has a small coloured number beside it. Barcelona xG 29.40 and a green -1.60, Betis xG 13.15 and a red +4.15. What is it? Hover a column header and a short explanation of the abbreviation appears, but the small number itself is not explained anywhere we could find. A tooltip is not something you can screenshot, so take the arithmetic below on trust or check it yourself.
It is the model minus the real figure. Barcelona 29.40 minus 31 goals is -1.60; Betis 13.15 minus 9 goals is +4.15.
The colours are the awkward part. Green in the xG column means the team scored more than it created, red means less, and in the xGA column green means it conceded less than expected. In the xPTS column the colour flips: Betis 9.83 minus 16 points is -6.17 in red, Villarreal 13.33 minus 8 is +5.33 in green. Green in xPTS means the team is owed points, red means it has collected more than its shots deserved.
In practice you look for one thing: a red xPTS number next to a high place in the table.
NPxG, PPDA and the columns hidden behind the gear
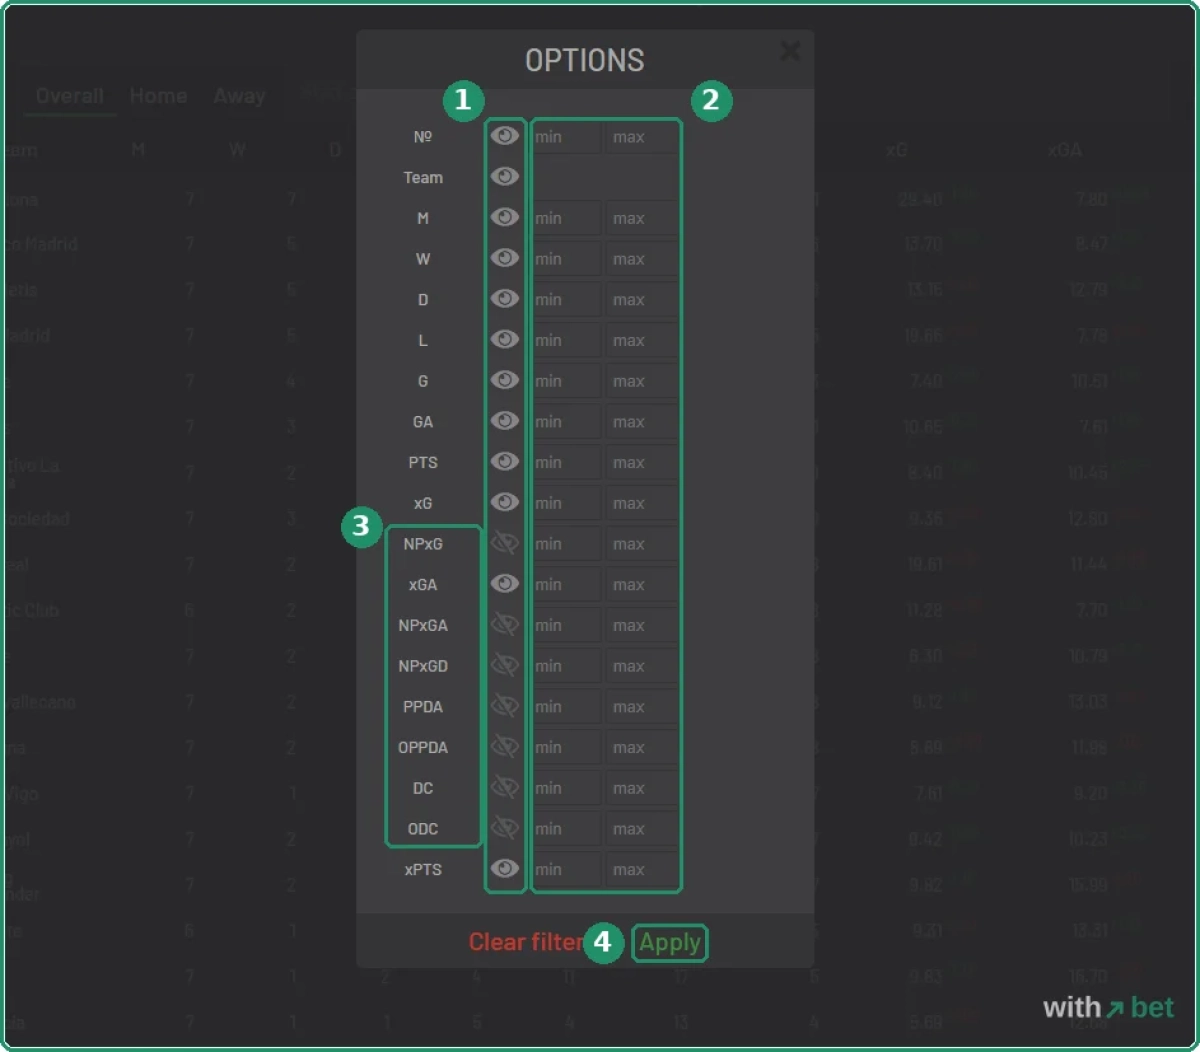
The gear icon on the right of every table opens an Options window. Each column has an eye icon and a min-max filter. On the league table the eyes for NPxG, NPxGA, NPxGD, PPDA, OPPDA, DC and ODC are switched off. Click them on and seven more columns appear.
NPxG is xG without penalties, which matters because the model rates a penalty at about 0.74 whoever takes it. PPDA is passes allowed per defensive action in the opponent's half, a pressing measure: a low number means the team presses high. DC is deep completions, passes completed within about 20 yards of goal, crosses not counted. Each of those has a one-line explanation when you hover the header, and nothing more. The Options window is also where the filters live: set PTS max to 10 and you get only the bottom half.
Home and Away tabs sit above the table. They add up: Barcelona's home xG 14.35 plus away 15.05 is the 29.40 in Overall, 8.50 plus 9.94 is the 18.44 xPTS. We checked every Barcelona figure across the three tabs. Not one was off by a hundredth. Keep that in mind two sections from here.
A team page: fixtures, situations and the 0.74 penalty
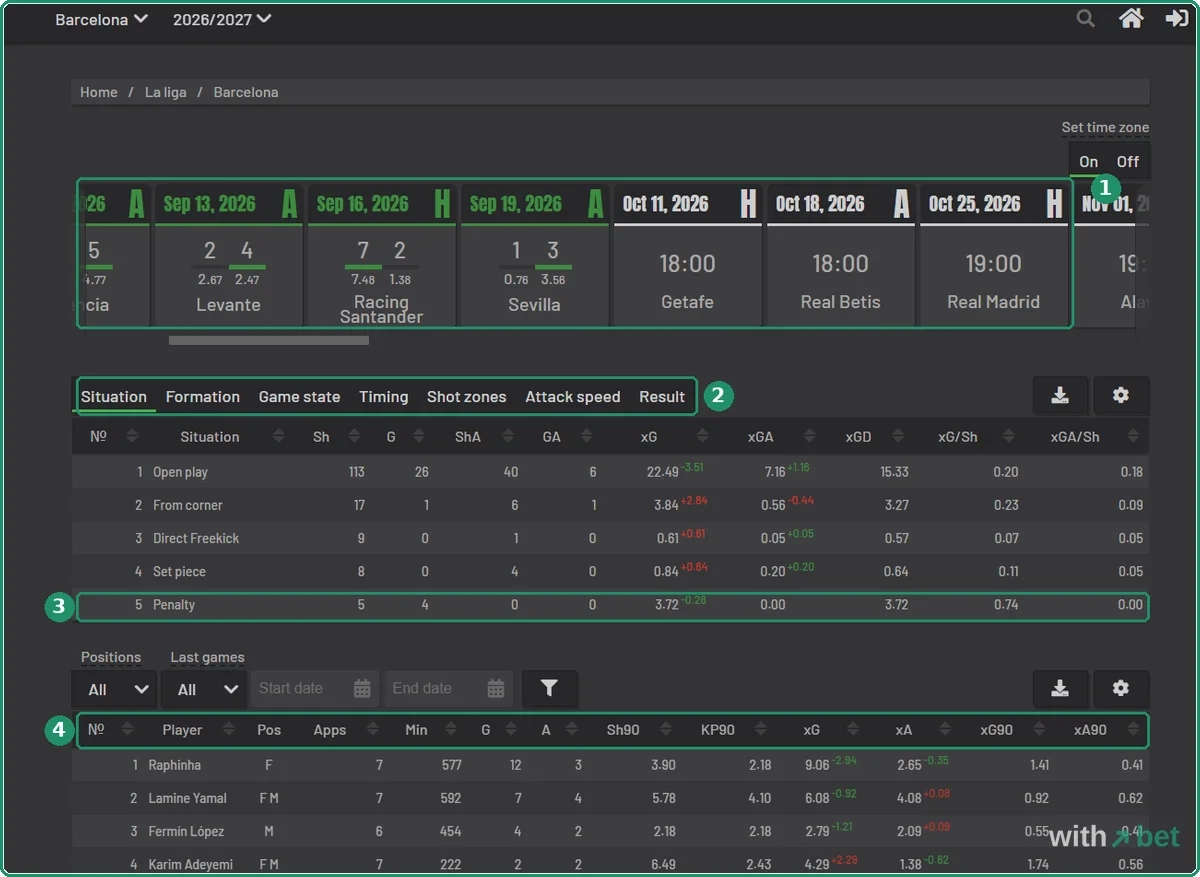
Click a team and the top of the page is a strip of results with the xG of both sides under the score. Barcelona at Levante on 13 September: 2-4 to Barcelona, xG 2.67 to 2.47. Won by two, out-created by a tenth.
Three days later, Racing Santander 7-2, xG 7.48 to 1.38, a score the model agrees with. The strip also shows the next fixtures with kick-off times in your time zone.
Under it is a table with seven tabs: Situation, Formation, Game state, Timing, Shot zones, Attack speed, Result. Situation splits the team's shots into open play, corners, direct free kicks, set pieces and penalties, with xG and xGA for each. Barcelona had taken five penalties for an xG of 3.72, which is 0.74 per kick. It is the cleanest way to see what an xG number is. A penalty is scored about three times in four, so before anyone kicks it, it is worth about three quarters of a goal.
Then the squad: every player with minutes, goals, assists, shots per 90, key passes per 90, xG, xA and the per-90 versions. Raphinha at that point had 12 goals from an xG of 9.06. Finishing very well, or due a quiet month? Seven matches cannot tell you, and the model does not try.
Two tables, two xG totals for the same seven matches
One number on the Barcelona page did not add up.
The Situation tab lists five shot types with an xG for each: 22.49 open play, 3.84 corners, 0.61 direct free kicks, 0.84 set pieces, 3.72 penalties. The sum is 31.50. The league table gives Barcelona 29.40 for the same seven matches, and the squad table under the Situation tab totals 29.50.
The goals agree. Situation says 26 + 1 + 0 + 0 + 4 = 31, the league table says 31. Only the xG differs, by 2.10 between two tables on one site, one team, one screen. We took the screenshots a minute apart. The xGA differs too, 7.97 in Situation against 7.80 in the league table.
We do not know why. Maybe the Situation tab counts something the league table leaves out, maybe one part of the site updates later than another; nothing on the page explains it. When you quote a team's xG, say which table it came from. We use the league table, because the xPTS column is built on it.
Understat player stats: per 90, a radar, a shot map
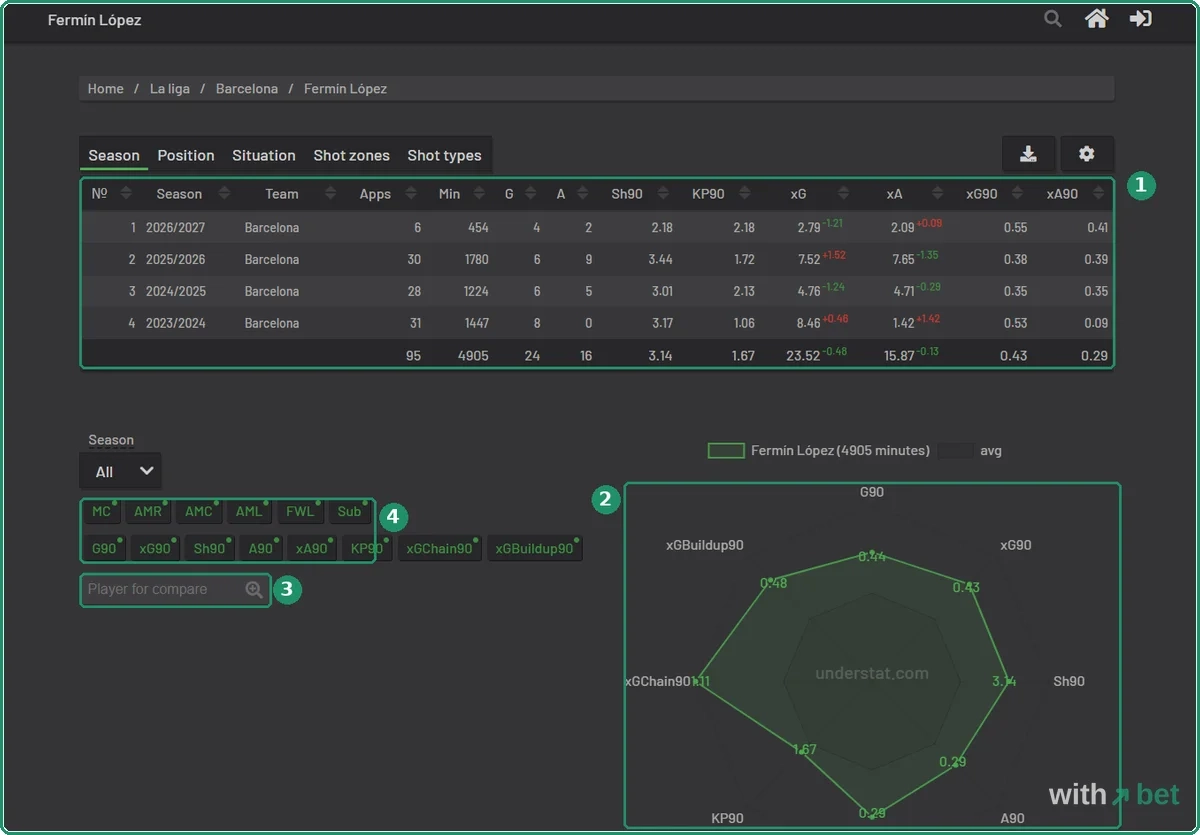
Understat player stats open with a season-by-season table. Fermín López: four seasons at Barcelona, 95 appearances, 4,905 minutes, 24 goals from 23.52 xG, 16 assists from 15.87 xA. Under it is a radar of eight per-90 measures with an average player drawn over it for comparison. There are filters by position played and a box to add a second player to the same radar. Who does he compare with? Type a name and the second line appears.
Below the radar is the shot map: every shot of his career on one half-pitch, bigger circles for bigger xG, colours for the result. Filter by season, situation or result. Hover a circle and you get the same box as on a match page: the minute, the assist, the body part and the xG of that shot. Then a match log, ten matches a page, with xG and xA per match.
One warning about the per-90 columns. Gabriel Jesus showed 14.21 shots per 90 in the squad table. He had played 19 minutes. Alex Balde: 2.89 expected assists per 90, seven minutes on the pitch. Anything divided by a handful of minutes comes out huge, so read the Min column first and ignore a per-90 figure below a few hundred minutes.
Understat match page: two shot maps, one xG per shot
Getafe 1-1 Celta Vigo, 7 September. The Understat match page draws both teams' shots on one pitch, each shot a circle and each goal a star. The xG total of each team sits in large figures over the pitch: 1.46 for Getafe, 1.42 for Celta. Both created about a goal and a half, both scored once.
They got there differently, though. Getafe took 10 shots, Celta 16. Getafe's goal came from a 0.65 chance, Martín Satriano at 20 minutes; Celta's from a 0.38 chance, Carl Starfelt at 56. Celta had 13 key passes to Getafe's three and still made no better chances. Sixteen shots for 1.42 xG is under 0.09 a shot. It says something about how Celta attacks, and it is three clicks from the home page.
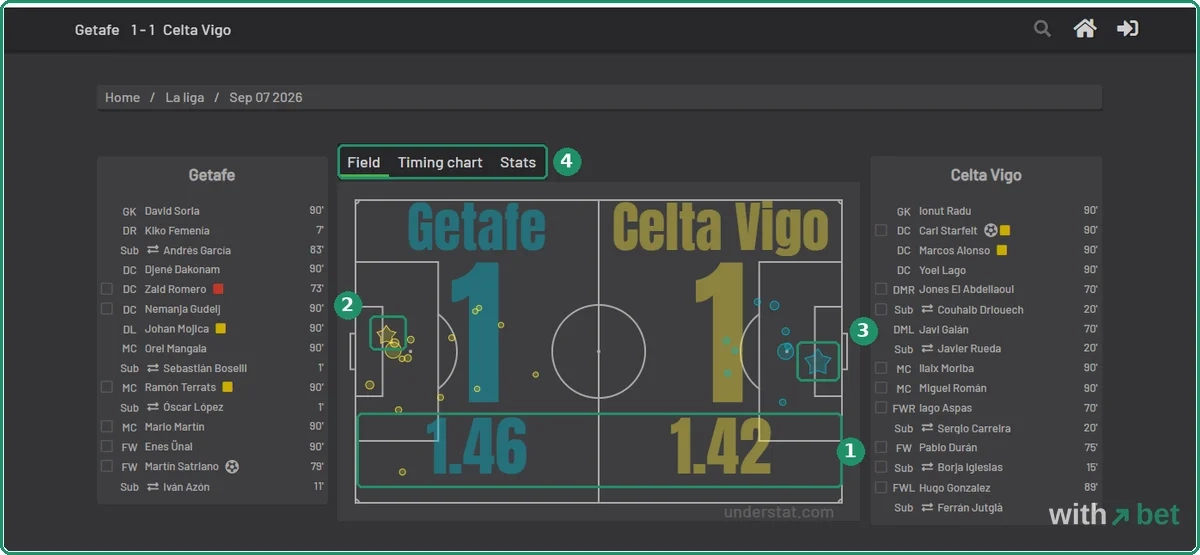
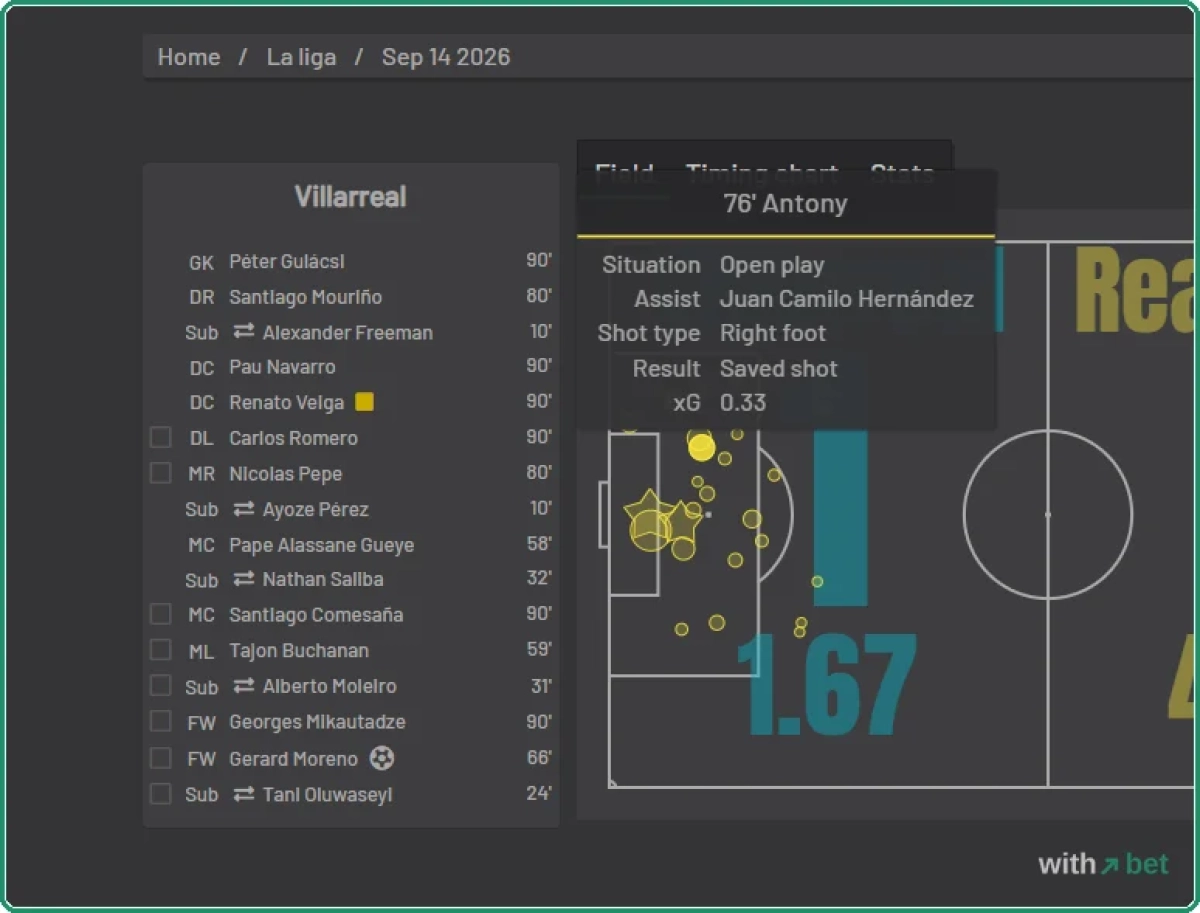
Three tabs sit above the pitch: Field, Timing chart and Stats. Under the pitch there is a timeline of goals, cards and substitutions, then a player table for each team with shots, key passes, xG and xA. The player rows add up to the team total to the hundredth: Getafe's six shooters sum to 1.46. Hover any shot for the detail. On Villarreal against Real Madrid a week later, Antony's shot at 76 minutes reads Open play, Right foot, Saved shot, xG 0.33.
Understat historical data: every season back to 2014/15
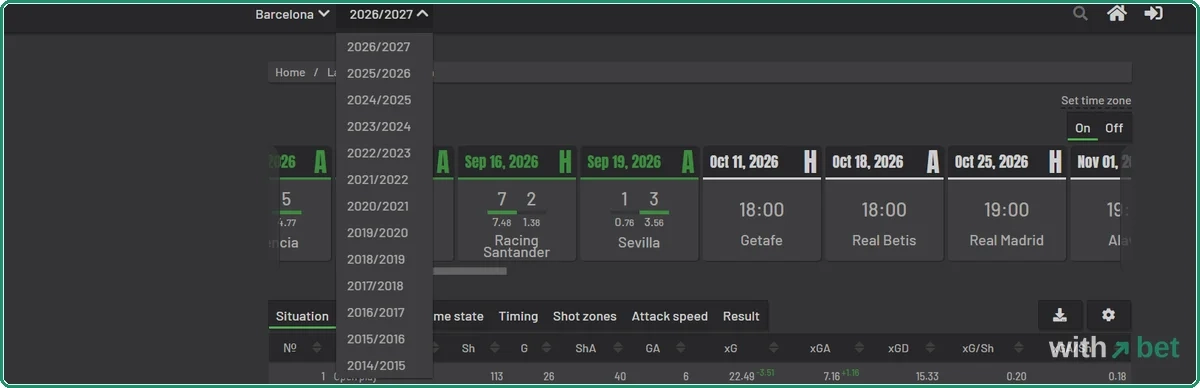
The season menu on any page runs from 2026/2027 back to 2014/2015, thirteen entries. Every one opens the full league table, every team page and every match page for that year, so the historical data is as deep as the current season. Players get the same: Fermín López's shot map goes back to his first minute in La Liga.
The league page also has a fixtures view with prev week and next week buttons and a time zone switch. Nothing pre-match, no lineups, no odds. It is a list you come back to once the match is played.
Understat data export: CSV in one click, no API
Understat data leaves the site through the download icon next to the gear, which saves the table you are looking at as a CSV. We opened the Barcelona squad export in Excel: 23 rows, 12 columns, the same numbers as the screen. The column names are not the ones on screen; shots per 90 comes out as sp90m and key passes as kp90. And the numbers arrived with a comma where the screen has a point, 3,9 instead of 3.9, because the file follows your computer's settings. Check that before you sort.
There is no Understat API, the kind of access a program uses to pull data automatically, and no bulk download. People who want it write scripts that read the pages, and free ones exist, understatapi for Python among them. Understat has never published rules about that. Without a script you export a league season table by table.
Understat login: an email, a password, no explanation
The icon at the top right opens the Understat login and registration form: email, password, Remember me, Enter. Nothing on the site says what an account gives you. We could not find a features page, a pricing page or a single locked element. Every table, map and export on this page was reached without signing in.
Saved settings, probably. We did not register, because there was nothing to unlock. A Russian review site that did register reported an empty page marked as under development after login; we cannot confirm that, and it may have changed since.
Understat vs FBref, SofaScore and FotMob
Understat vs FBref used to be a fair fight. FBref lost its xG columns in January 2026 when Opta ended the data deal; our FBref review covers what stayed. Since then Understat is the only free site we have found with a full season of xG in one table you can sort and download. FBref still wins on the number of competitions: more than 100 with basic stats against six here.
The apps are the other Understat alternative. SofaScore and FotMob show xG for far more competitions, but one match at a time, on their own models, with no season table and no export. If you bet on the six leagues Understat covers, use it for the season view and an app for a match it does not have. Outside them it cannot help you at all. Our page on FBref alternatives sorts this by which number you need.
Five steps before a bet
- Open the league, click the gear and switch on NPxG and PPDA. Apply.
- Sort by xPTS. Find the two teams in your match and compare xPTS with PTS. A gap of four points or more after ten matches is worth a note.
- Open each team page. Read the results strip: is the team winning matches where the other side created more? Check the Situation tab for penalties, since several penalties push a team's xG up.
- Open the last match of each team. Look at the shot map, not the score. Ten shots from outside the box can add up to 0.6 xG.
- Add the two teams' xG per match and read the total against the over/under line. The method for turning that into a fair price is in the xG guide linked at the top of this page.
What Understat does not show
No odds, so you bring your own price from an odds comparison site. No expected goals on target, the version the apps print that also counts where the shot went. No lineups before a match. No Understat app, only the website. No women's football, no cups, no second divisions. No explanation of the model beyond a paragraph on the home page and the hover hints on the headers, and no note about which table is right when two disagree.
None of it is behind a paywall; the site just does not have it.
Rating 4.0: six leagues done well
Understat does one job and does it for free. Every season since 2014/15 in xG tables, a shot map for every match, a download on every screen, no account. For the six leagues it covers, it is the only free site we have reviewed with a full season of xG in one table.
It loses a point for three things: six leagues and no way to add a seventh, a company that is one email address, and two tables on the same team that gave two xG totals a minute apart without a word about why. The last one weighs most. The only product here is a number you are supposed to trust.
Rating 4.0 out of 5. FBref, which kept its 100 competitions and lost its xG, sits beside it rather than above it.
Frequently asked questions
Is Understat free?
Does Understat have an app?
Which leagues does Understat cover?
Is Understat better than FBref?
