Dropping odds explained: what the pages show and leave out
Dropping odds are bookmaker prices that have gone down since the opening odds or within the last hours. Every odds comparison site lists this odds movement, and every betting blog calls it a signal. This guide explains what a dropping odds row means, how its percentage is built, and what the pages leave out.

A dropping odds row: from 4.60 to 1.80
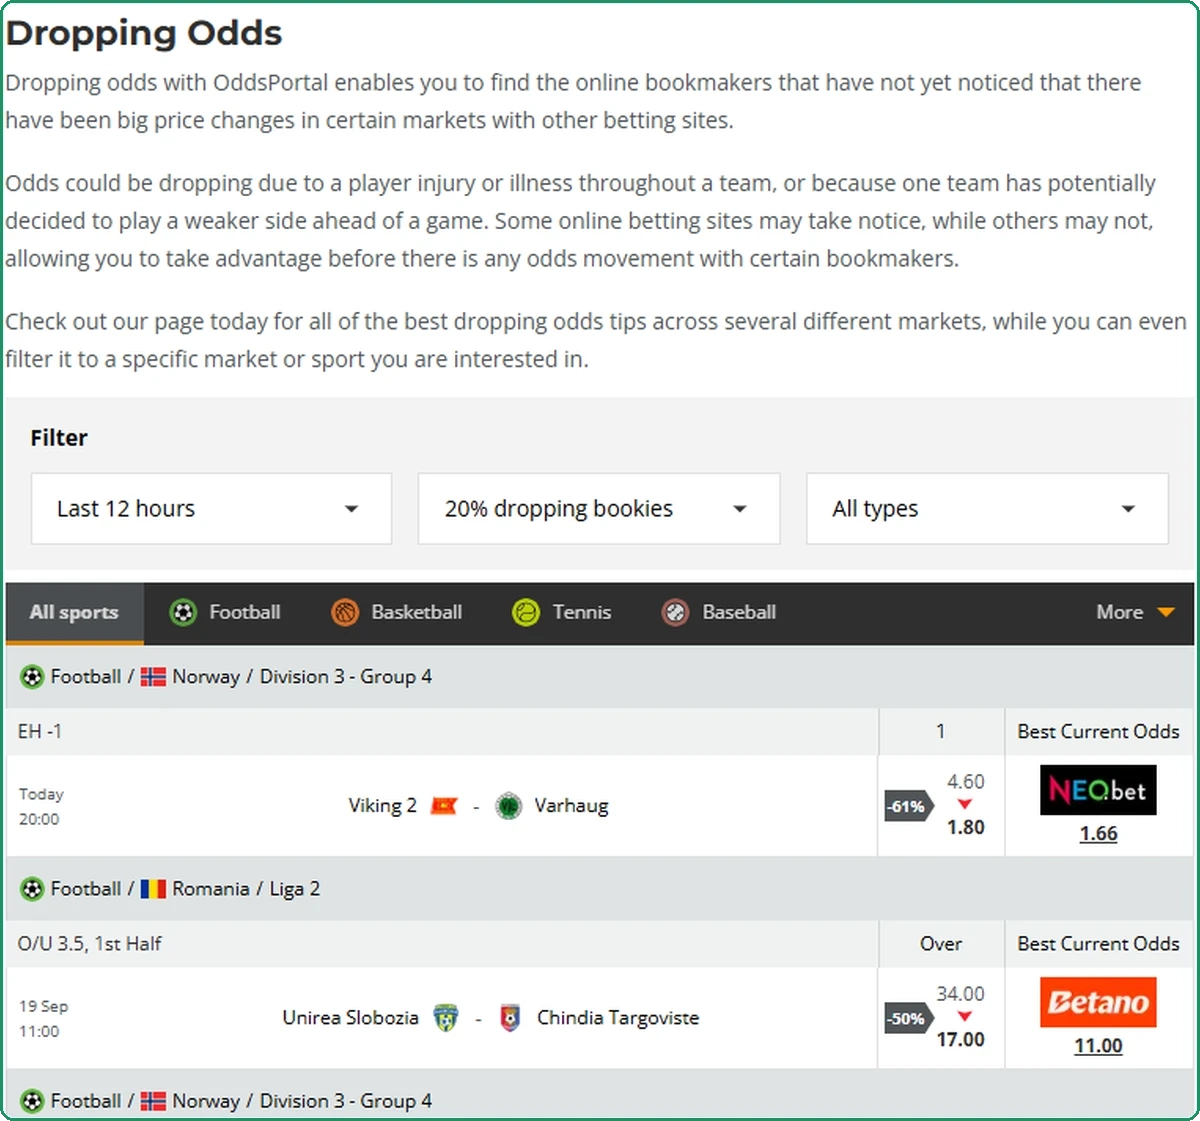
On the afternoon we opened it, the OddsPortal dropping odds page opened with a match from the fourth level of Norwegian football, Viking 2 against Varhaug. The market was a European handicap of one goal.
The price had been 4.60. It was now 1.80. The badge next to it read −61%.
The outcome was priced at 4.60, and within the filter's twelve hours it was cut to 1.80. Whoever took the 4.60 holds a bet that the market now prices at less than half.
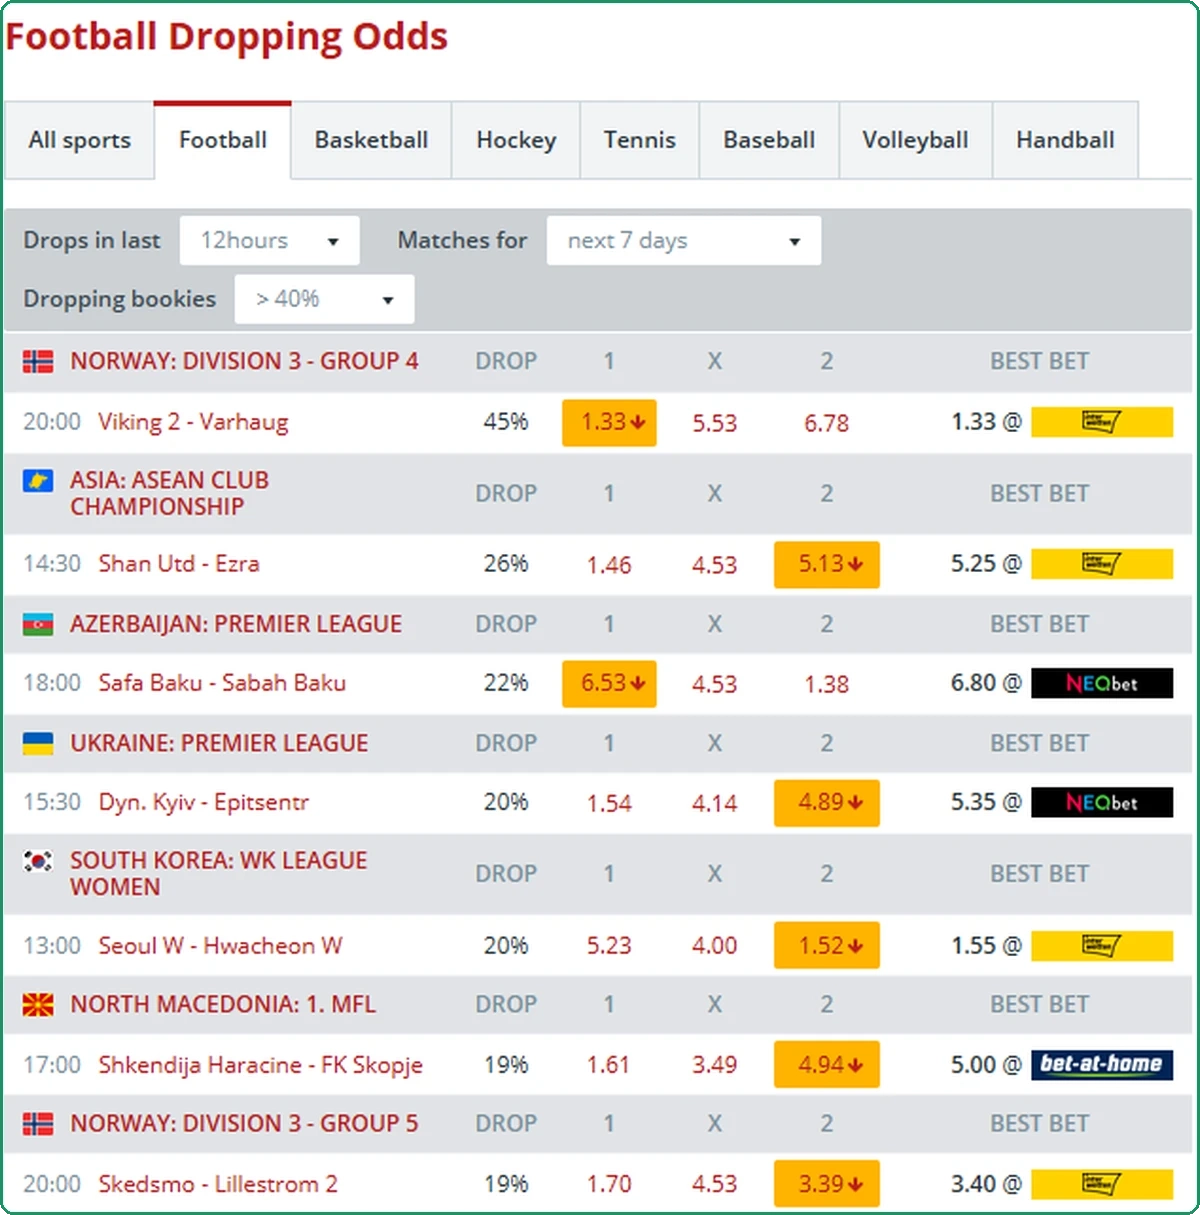
The same match was the first row on the BetExplorer page too, in the 1X2 market this time. The home win had dropped to 1.33, badge 45%. Two sites, one match, two different percentages. The reason is in a later section.
Four sixty to one eighty in a few hours, on a fourth-division match. That is the first row on the page.
What the percentage on a dropping odds page measures
On OddsPortal the badge is the change in the price. 4.60 to 1.80 is a fall of 2.80, and 2.80 divided by 4.60 is 61%. The badge says nothing more. How many bookmakers moved is in the filter, not in the badge, and how likely the outcome has become is in neither.
To see the second thing you need the implied probability, which is one divided by the price. At 4.60 the outcome was priced as a 22% chance. At 1.80 it is priced as a 56% chance. The price fell by 61%, the probability rose by 34 points. The same move gives two very different numbers.
A smaller example makes the gap clearer.
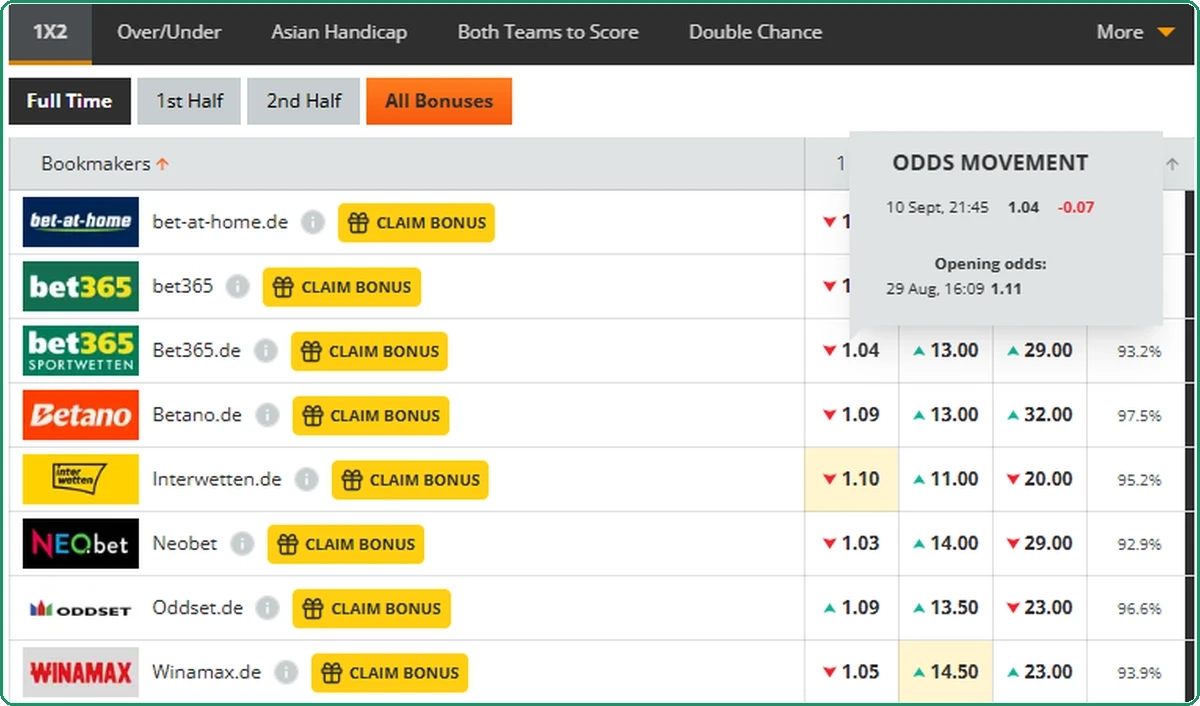
A favourite on a Champions League match had opening odds of 1.11 and was cut to 1.04. The price fell by 6%. The implied probability went from 90% to 96%. Six points on a favourite is a large move, and the percentage badge would call it small.
Our odds converter turns any price into a probability, so you can check both numbers on any row.
Why odds drop: four reasons and what the page shows of them
Bookmakers cut a price for four reasons.
Team news: a lineup, an injury, a rested squad. Sharp money, which is the trade name for bets from professional bettors, who bet large and early and whose bets bookmakers respect. Public money, which comes late and follows names. And plain housekeeping: a price that was too generous at opening is trimmed to bring the margin back.
A dropping odds page shows none of these. It shows the price before, the price after, and the percentage. Which of the four reasons is behind the row is for you to find out. On a Norwegian fourth-division match there is nowhere to find it.
The OddsPortal page says this in its own words. Its introduction talks about “a player injury or illness” and one team deciding “to play a weaker side”. Those are the team-news cases. They are the easiest to explain, and on the lists we opened nothing showed which rows were that case.
One bookmaker moving and a market moving
A price can fall at one bookmaker because that bookmaker took a bet it did not like, or because someone in its trading room corrected a mistake. Neither tells you anything about the match.
A price falling at most bookmakers at the same time is different. It means many separate trading rooms reached the same view.
The pages know this, and each has a threshold. OddsPortal's default filter is “20% dropping bookies”: a row appears when a fifth of the bookmakers on the match moved. BetExplorer's default is stricter, "> 40%". BMBets sets its Blocked Matches page at 25% for a related question. You can change all three.
BetExplorer prints the count behind the share. On one match its column read “8/20”: eight of twenty bookmakers dropped. On another it read “25/25”. The second row is a market moving. The first is less than half of it.
A fifth of the bookmakers is the default on one site. More than 40% is the default on another. The row you see depends on the number you set.
What the lists contain on an ordinary day
On the first screen of each list, on the day we opened them: Norway Division 3, Romania Liga 2, the ASEAN Club Championship, the Azerbaijan Premier League, the South Korean women's league, the North Macedonian first league, Bulgaria's second division. One Ukrainian Premier League match.
No Champions League row. No Premier League row. Further down the lists may differ, and on another day they will.
This is not an accident of the day. Big matches have many bookmakers, large limits and prices that move by a tick at a time, because every trading room watches every other one. Small matches have few bookmakers and small limits, and their opening odds can be wrong by a lot. When a match has five bookmakers, one of them is 20%. A wrong opening price corrected by the few books that price the match is exactly what a dropping odds filter catches.
So the list is a list of small markets by design. That is where drops of 40% and 60% happen. It is also where a bettor with a normal account gets the smallest limits.
The same match, two sites, two percentages
Viking 2 against Varhaug was on both lists with different numbers, −61% on OddsPortal and 45% on BetExplorer.
Neither site is wrong. OddsPortal's row was the European handicap market. BetExplorer's row was the 1X2 home win. Different markets move by different amounts, and each site picks the row it lists by its own rule.
There is a second difference. OddsPortal's badge is the fall on the price shown in the row. BetExplorer's filter counts how many bookmakers moved before a match gets on the list, and its DROP column appears to give the fall on the highlighted price; the legend under the table speaks of drops of 5 to 9 percent, 10 to 14 and over 15. Read each site's number on its own terms, and do not add them up.
Rising odds are the same story in reverse
A dropping odds page has a mirror image that these pages do not print. When a price goes down on one outcome, a price on another outcome usually goes up.
Our BetExplorer review had a live example. The home price on a Champions League match opened at 2.66 a week before kick-off. On the day it was 3.54, a rise of 33%. The market had moved away from the home team, which means it had moved toward the draw or the away win. Whoever had 2.66 was holding a price the market no longer offered.
A rising price is the same signal as a falling one, and it is no reason to bet the other side. The market has learned something since opening, and you learned it later.
Two sixty-six to three fifty-four in a week. The market moved away from the home team. Nobody printed that as a drop.
Dropping odds tools: OddsPortal, BetExplorer, BMBets, Oddspedia
OddsPortal: filters for time window, share of bookmakers and market type. A percentage badge per row. “Best Current Odds” with a bookmaker. An explainer and a FAQ under the table.
BetExplorer: the same three filters with a stricter default. The count of bookmakers behind the share. A colour legend under the table and nothing else.
BMBets: no dropping odds page as such. A Moving Margins page that lists line moves, where a total goes from 2.75 to 3 with the prices unchanged, and a Blocked Matches page that lists closures.
Oddspedia: a dropping odds page inside its tools menu, covered in our review of the site.
OddsPortal and BMBets explain their pages in their own text. BetExplorer does not. None of them says how the rows performed.
Blocked matches: when the drop becomes a closure
Blocked matches are the step after dropping odds. A bookmaker that does not want a market at any price takes it down. When several take it down at once, the ones still open are usually the slower ones.
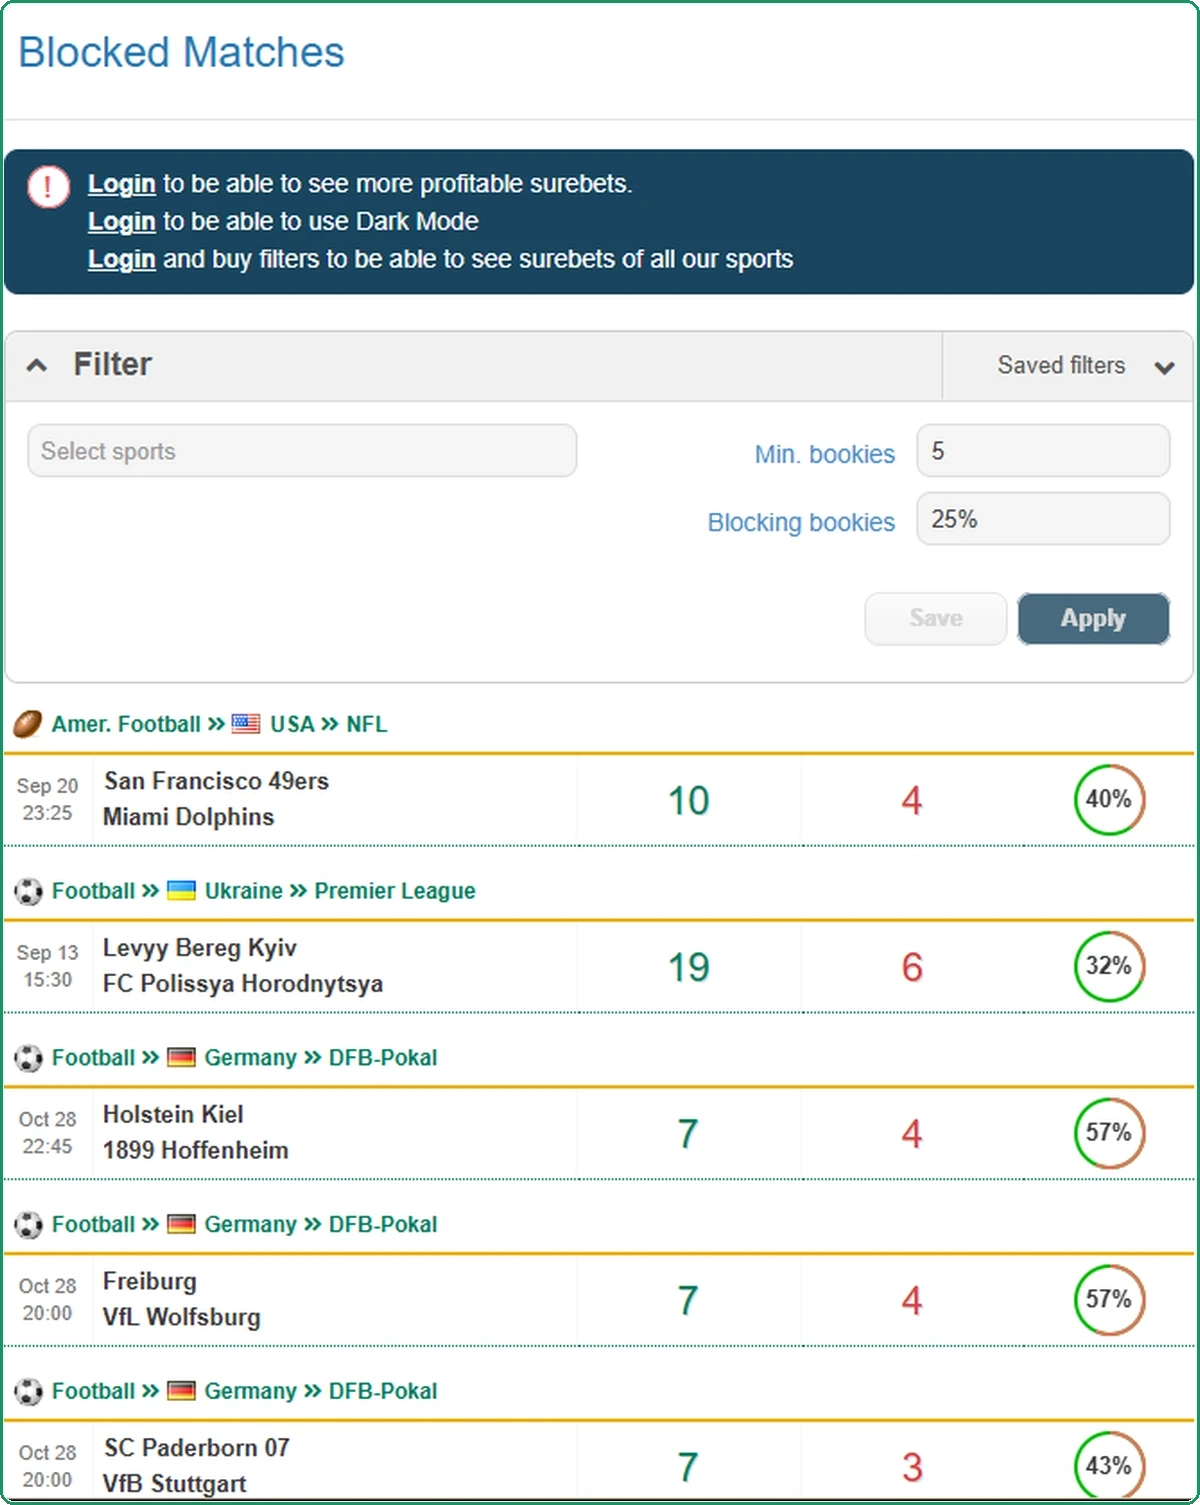
BMBets prints three numbers per row: bookmakers that priced the match, bookmakers that closed it, and the share. A Ukrainian Premier League match read 19, 6 and 32%. An NFL game read 10, 4 and 40%. OddsPortal has the same list under the name blocked odds.
A match on that list is a match to leave alone or to check again later. The open prices may not have caught up with whatever the closed ones saw.
Best current odds: the list is slower than the market
Next to the −61% row on OddsPortal, the “Best Current Odds” column read 1.66. The dropped price in the row was 1.80. So by the time the row was on the page, the best price on the match was already 8% below the price in the row.
This is normal. The page is updated at intervals, and the market keeps moving between them. The row tells you a drop happened. It does not tell you the drop is over, and the best price it shows is the best price at the last snapshot.
The practical point is short. If you bet on a row, the price you get at the bookmaker is not the price in the row.
How to read a dropping odds page in five steps
- Look at the league first. In a fourth division a 60% drop can be a handful of bookmakers correcting one bad opening price. In a top league a 10% drop is news or money, because dozens of trading rooms had to agree.
- Read the share of bookmakers before the badge. Eight of twenty is a few books. Twenty-five of twenty-five is the market.
- Convert the two prices to probabilities with the converter. A 6% price fall on a favourite can be a bigger move than a 40% fall on an outsider.
- Open the price history on the match page. A drop in one step at one time is usually news. A drop in ten small steps over a week is usually money coming in.
- Check the best current price. If it is already below the dropped price, the move has continued and you are late.
What dropping odds pages do not tell you
Whether the rows win. A dropping odds strategy, in the sense of a rule that turns the list into bets, is what the blogs sell. No site in this section publishes the results of its rows. None prints the share that went on to win or the return on following them. The blogs we read while preparing this guide promise a profit from dropping odds and do not publish one either.
Why the price moved. The four reasons above look the same on the page.
Whether your bookmaker moved. The badge is built from the bookmakers the site tracks for your connection. From another country the same page lists other rows.
Whether the move is over. See the section above.
No site publishes what happened to its dropping odds rows after kick-off. The pages show the drop and stop there.
Dropping odds and the closing line
The closing line is the last price before kick-off. Bettors who beat it over hundreds of bets tend to win; bettors who do not tend to lose. Our closing line value guide explains the arithmetic.
A dropping odds page is a live view of the same idea. Every row is a price that moved toward its closing value while you watched. If you held the old price, you beat the closing line on that bet. If you bet the new one, you are betting at the price the market has already reached, and the row gives you no edge.
This is the one use of these pages that survives the numbers. They show you where the market has been.
Who should open a dropping odds page
A bettor who already has a view on a match, and wants to know whether the market agrees. A bettor who tracks their own closing line value and wants to see odds movement as it happens. A bettor who bets small leagues and needs to know when a price has been corrected.
A bettor looking for a list of bets to copy will find Norwegian fourth-division matches and prices that have already moved. The odds comparison hub compares the four sites that carry these pages.
Frequently asked questions
What are dropping odds?
Why do odds drop before a match?
Is there a dropping odds strategy that works?
Which dropping odds tool is the best?
What does the dropping odds percentage mean?