
FootyStats: its own xG, a four-hour wait
FootyStats is a free football stats site with match pages for 1500+ leagues. We read a full match, two league pages and the paid terms. There are plenty of numbers, but the xG is its own, and the free view runs out fast.

Pros
- Free xG for lower divisions
- Shots, offsides and throw-ins free
- Terms rule out bookmaker ads
- API from £29.99 a month
Cons
- Few free match pages, then waiting
- Own xG, not comparable elsewhere
- Corners and cards need Premium
- Predictions list both sides
What FootyStats is for, in plain words
FootyStats turns past results into percentages for the markets bettors use most: over 2.5 goals, both teams to score (BTTS), clean sheets, corners and cards. Before a match, it shows how often each team hit each line in its recent games.
The best use is a quick check before a goals bet. Say you like over 2.5 goals in a match. FootyStats tells you in seconds that both teams went over in 4 of their last 10 games, and a price of 1.75 needs about 57%. You can turn any price into a percentage with our odds converter.
There is more on the site: xG, a predictions section, CSV downloads, an API for developers.
If xG is new to you, our xG guide starts from zero. In short, xG (expected goals) estimates how many goals a team's chances were worth. A team can score once from chances worth two goals.
Who runs FootyStats: Over-Under Digital, Canada
The site is operated by Over-Under Digital Inc., registered in Burnaby, British Columbia. Its About page says the company was founded in 2017 and work on the site began a year earlier. A Simon Fraser University alumni page names the founder as Jaime Tatsubana.
Match data comes from TheSports, a data company named in the footer. FotMob and WhoScored both run on Opta data.
There are 27 language versions besides English, plus apps for Android and iOS. We tested the website only.
Payments go through Paddle, a London company that sells the subscription on FootyStats' behalf. According to the About page, a card statement reads FOOTYSTATS or OVERUNDERDIGITALINC.
The FootyStats match limit
FootyStats counts match pages. In a fresh browser without an account, the fifth match we opened showed a lock screen with a timer: “You must wait 4 Hours 0 Minutes to view this match.”
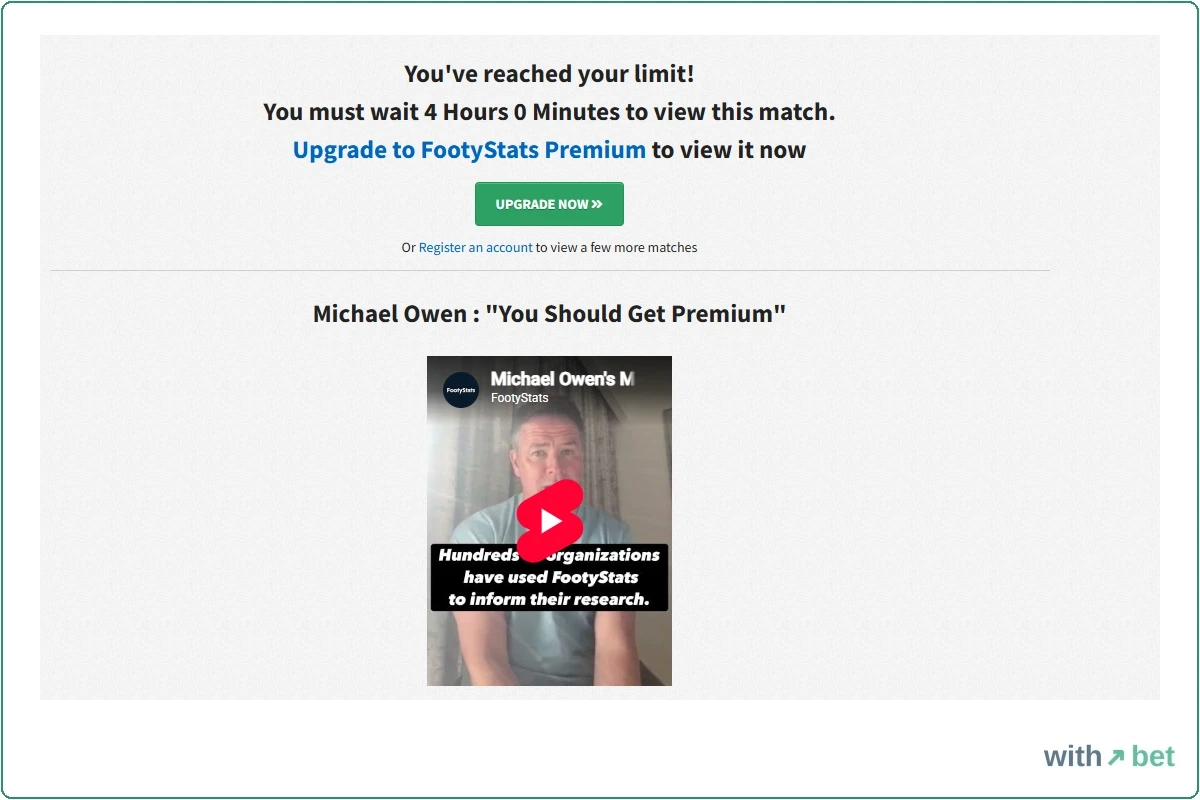
Under the button, the screen offers a free way out. “Register an account to view a few more matches.” A free Basic account did add a few, and then the same lock came back. The line inviting us to register was still printed on that screen, although we were signed in.
How many pages is “a few”? The site does not say. It also does not say whether switching between the Stats, Odds and Predictions tabs of one match counts as a new page. In our runs the number moved between tests.
Registering does not help once the lock is on. We signed up during an earlier four-hour wait, and the timer kept running from where it was.
League pages, team pages and xG tables stayed open the whole time.
So what does the limit take away? The match page, which is where FootyStats puts its head-to-head, both teams' form, the over/under tables and the bookmaker odds side by side. Most of it can be rebuilt from the two team pages, but that takes three tabs instead of one.
Reading one match page
We used Turkey v Italy in the Nations League, 28 September 2026. The page is long: head-to-head (H2H), form, goals scored and conceded, over/under and BTTS tables, corners, cards, half-time splits, goal timing, shots, offsides, free kicks, goal kicks, throw-ins and player lists.
The H2H block covered three past meetings. Italy won two, one ended 0-0, and the goals were 6 to 2 for Italy. We checked each percentage against the three results. All correct: over 2.5 in two of three, BTTS in one.
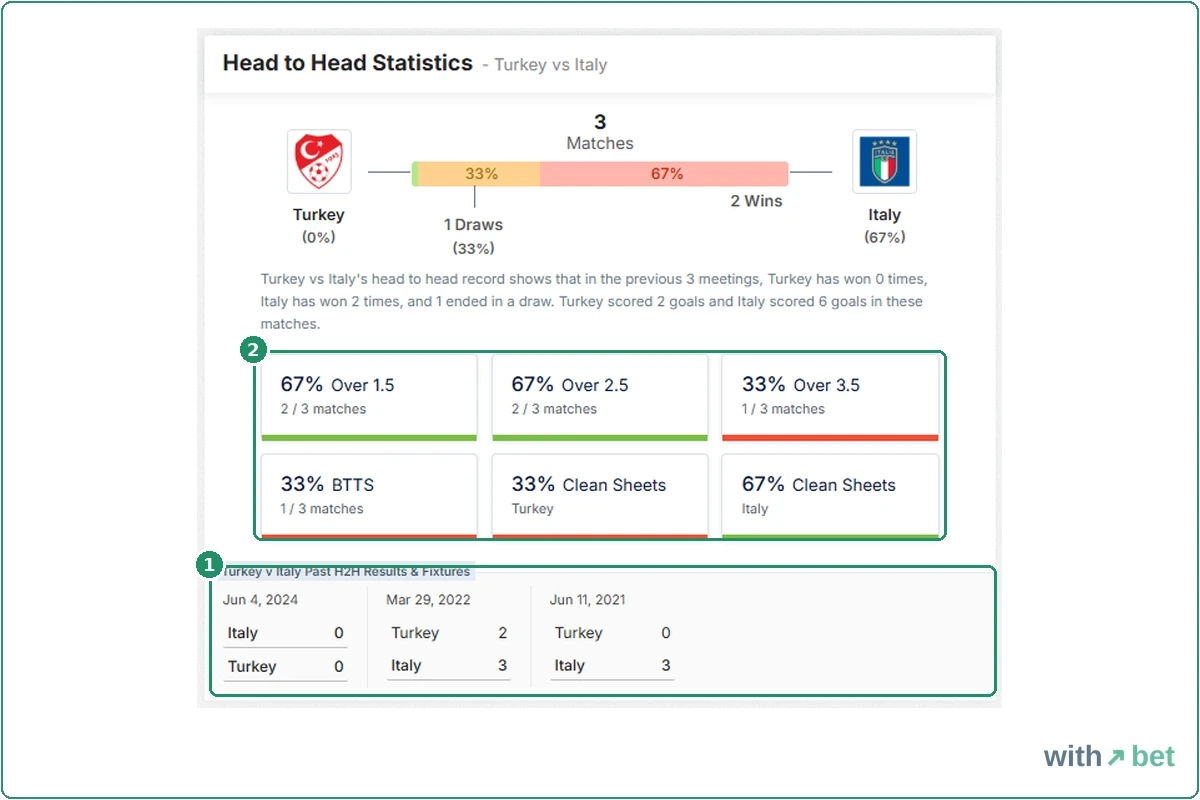
The page is labelled “International — UEFA Nations League”, and in that competition each team had played once. So the team figures come from each side's last 10 games, friendlies included. A small blue banner says so: “This is an international competition. Showing last 10 stats.”
Turkey's list has the USA, Paraguay, Australia and Venezuela. Italy's has Greece, Luxembourg and Northern Ireland.
So a 70% on this page means seven matches out of ten, some of them friendlies.
The player lists do use the Nations League alone. That is why every Turkey and Italy player sits on zero goals, and why Italy's “Which players will score?” list opens with the goalkeeper, Gianluigi Donnarumma.
PPG, form strips and colour codes
PPG means points per game: three for a win, one for a draw, divided by games played. It is the number in the coloured box next to every team on the FootyStats match list. Turkey's 1.90 comes from 6 wins, 1 draw and 3 losses, so 19 points from 10 games. Italy's 2.20 is 22 points from 10.
Form strips show the last five results, oldest on the left.
Colours run from red through yellow to green. On the match page they read as good or bad for the team, so Italy's 10% failed-to-score is green and Turkey's 30% is yellow. The Espanyol team page seems to colour by size instead. There, “Losses 57%” is green and “Wins 29%” is red.
Odds Market: win rates, not probabilities
Next to the H2H block sits a box called Odds Market. Each row pairs a price with a “Stats” figure. For Turkey v Italy it read: Turkey win 2.45 and 60%, Italy win 2.45 and 70%, draw 3.62 and 10%.
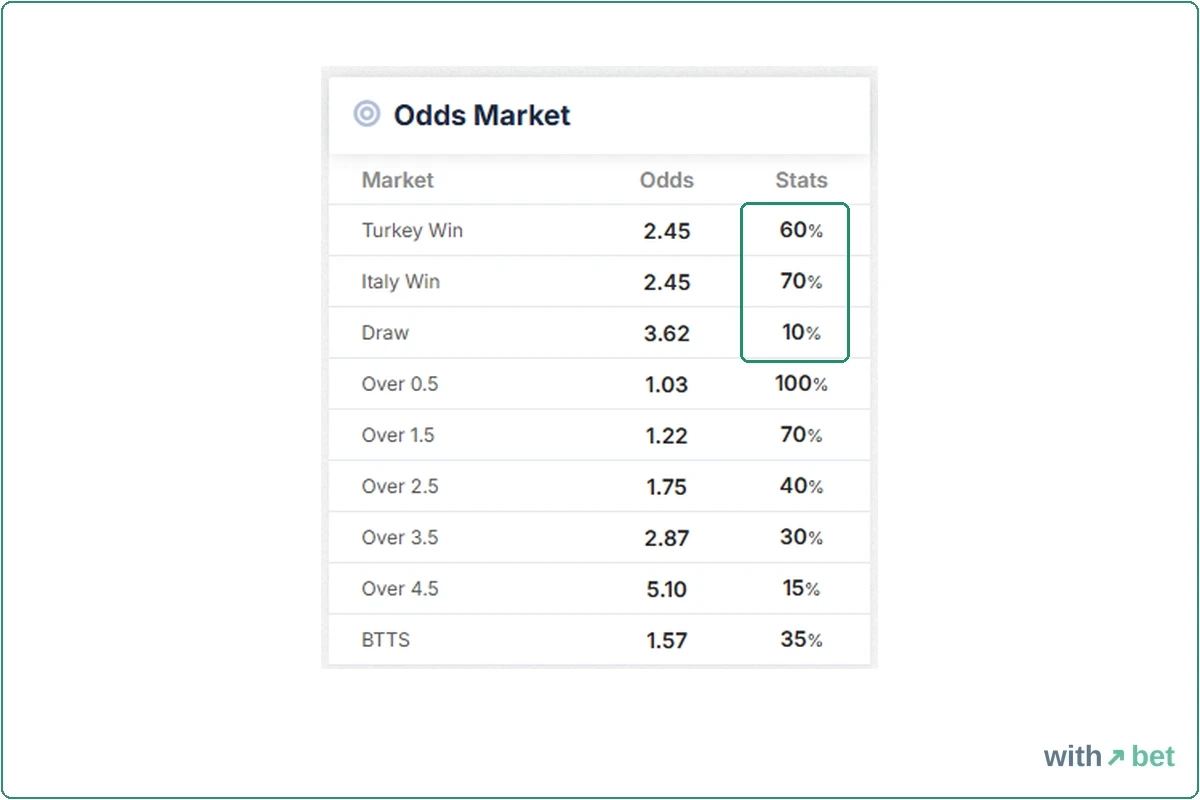
Chances of three results that cover every outcome add up to 100%. These add up to 140%. Each one is a team's own record: Turkey won 60% of its last 10 games, Italy 70%, and each drew once. The three prices, for comparison, add up to about 109%, and the extra 9% is the bookmaker's margin.
Why does this matter? A beginner could read 60% next to 2.45 and see value, because 2.45 means about 41% (1 ÷ 2.45). But the 60% is Turkey's win rate against other opponents, mostly in friendlies. None of those ten games was against Italy.
The over 2.5 row shows the trap from the other side. The price is 1.75, the record 40%. A fair price for 40% is 2.50, and 1.75 needs about 57%.
The box does not say which bookmaker its prices come from, and they move. By the evening it showed Turkey at 2.54 and Italy at 2.65.
The match page's Odds tab does name bookmakers. Across its tables we counted eleven, from Pinnacle, bet365 and Betfair to MelBet and Cashpoint, with the best price in each row in green and the lowest in red. Most tables show two to six of them. For over 2.5 goals the row ran from 1.65 at BetVictor to 1.74 at 1xBet and Sbo.
Where the home and away labels slip
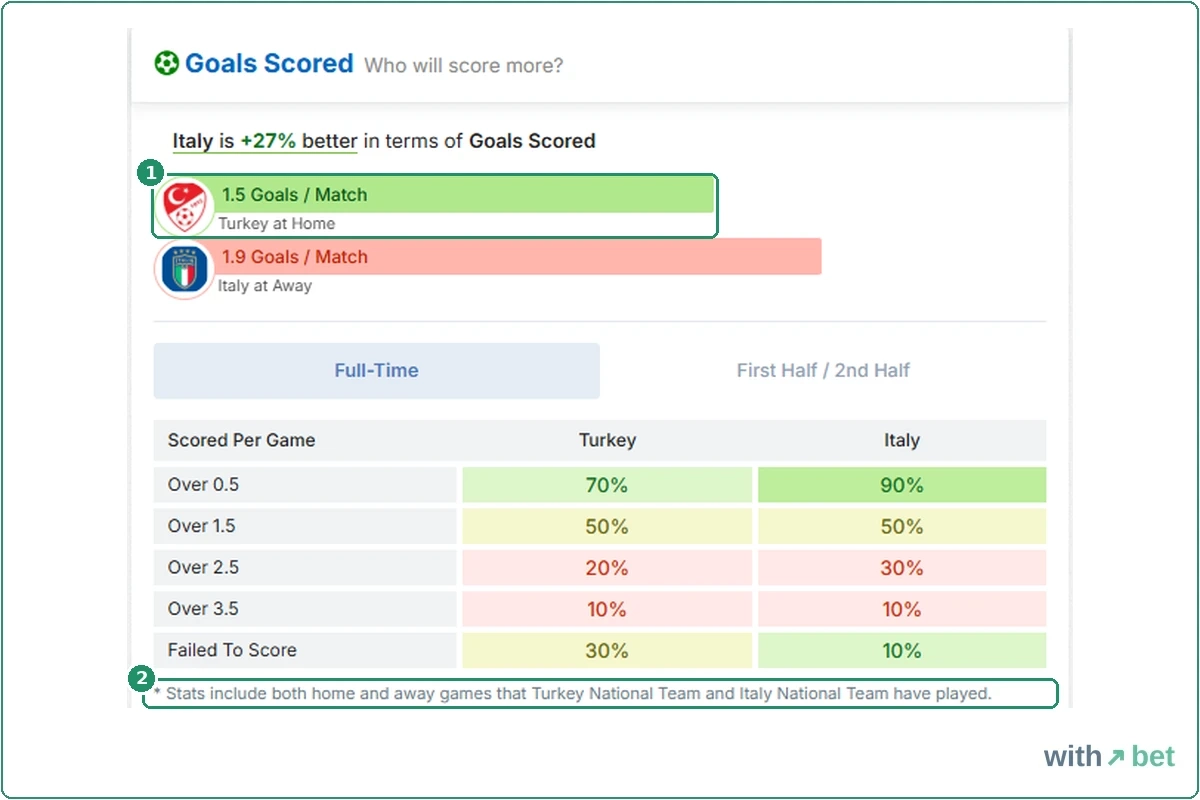
The Goals Scored block has two bars: “1.5 Goals / Match, Turkey at Home” and “1.9 Goals / Match, Italy at Away”. The team tables on the same page give Turkey 1.67 at home and 1.50 overall, Italy 2.17 away and 1.90 overall. The bars carry the overall figures under home and away labels. A footnote under them even says the numbers include both home and away games.
Goals Conceded repeats it. Turkey “at Home” shows 0.9, which is the overall figure, while the home figure is 0.67.
The written Fixture Analysis gets the last meeting wrong. It says the previous match ended “Turkey 0 — 3 Italy”. The H2H block just above lists 4 June 2024, Italy 0-0 Turkey, as the latest. The 0-3 was in 2021.
The same text says that “so far this season in the UEFA Nations League”, Turkey have averaged 2 points per game at home. Turkey had played one Nations League match and lost it. The 2.00 is Turkey's home PPG over the last 10 games.
Some averages do not add up either. In the shots table, Turkey average 17.80 shots per match and Italy 17.40, yet the Average column prints 18.00. Italy's “Over 2.5 Offsides” reads 13%, which cannot come from 10 games. One in eight fits, so offside data exists for 8 of Italy's 10 matches. The page does not say that.
FootyStats' own terms cover this: “We strive to elevate to 90% coverage for each league, but no guarantees!”
FootyStats xG: a formula of its own
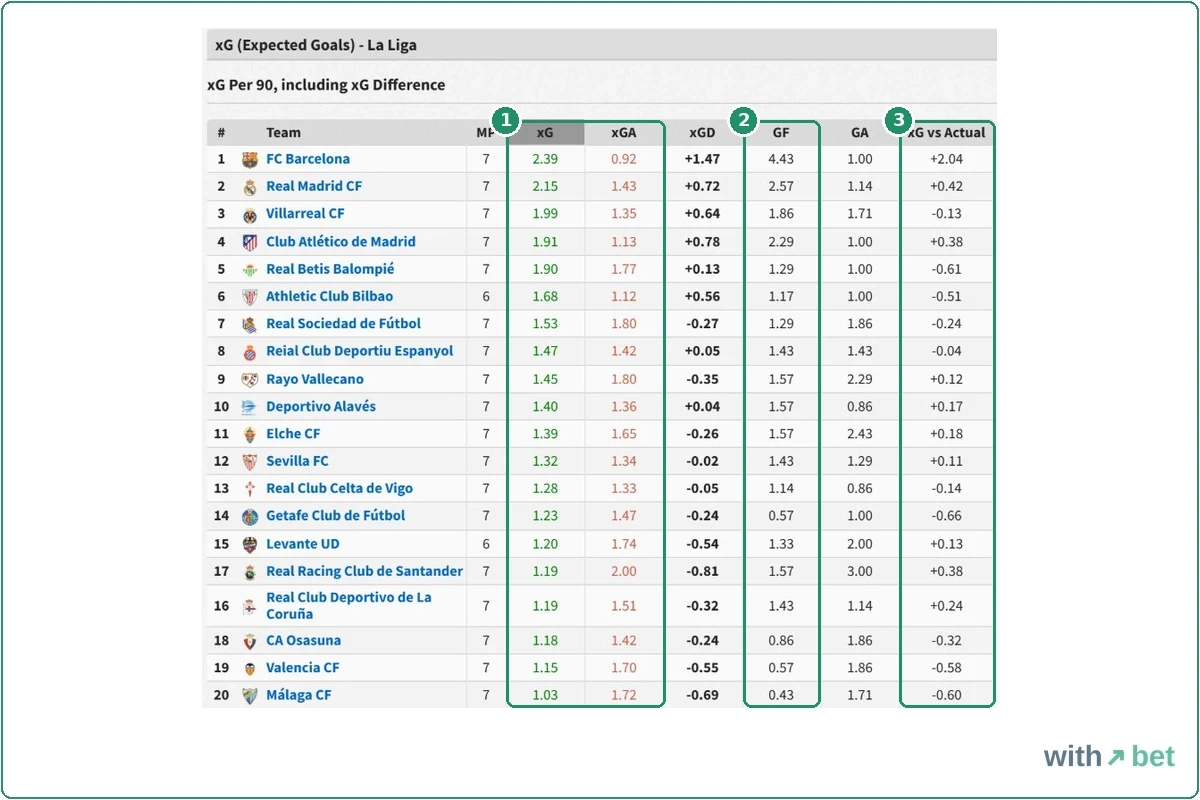
Each league's xG page ends with a short note on how the number is made. FootyStats calls it “a unique formula” built from shots on and off target, the number of shots, “attack dangerousness” and possession, including how deep it goes. The note says traditional xG uses only the position of the shot.
Most xG models look at more than position. The Opta model behind FotMob and WhoScored values each shot by its location, the body part, the type of pass before it and similar details. Understat builds its own model on the same principle.
FootyStats' own explainer on its main xG page agrees with them. It lists assist type, distance from goal, type of attack, shot angle and the body part used. The league pages still say traditional xG uses position only.
FootyStats adds two things those models leave out: whether the shot hit the target, which is only known after it was taken, and possession, which counts even when no shot comes of it.
FootyStats xG is a different metric with the same name.
In practice, a FootyStats figure cannot sit next to one from Understat or FotMob. If you bet with an xG rule, say backing overs when both teams average above 1.5, set it on FootyStats data alone.
The same formula explains the coverage. It needs shot counts and possession, which exist for almost any match, and no map of where each shot came from. That is how FootyStats prints xG where other free sites print nothing. Its Spanish list runs from La Liga down to eighteen regional groups of the Tercera, the fourth tier, plus women's leagues and cups. On FotMob, the whole Bolivian top flight had no xG at all when we checked it for our FBref research.
Team xG against player xG
The La Liga xG page also has a player table, and it does not match the team table above it.
Barcelona's team xG is 2.39 per match. Over seven matches that makes about 16.7. The player list gives Raphinha 9.54, Lamine Yamal 7.07 and Fermín López 3.48. Together that is 20.1, more than the whole team's 16.7.
Raphinha's 9.54 comes from 25 shots, or 0.38 per shot. For comparison, a penalty is usually valued at about 0.76 in classic models, and most open-play shots sit well under 0.2.
The player numbers may come from a different calculation. The page does not say.
The site-wide xG page has stranger figures still. Its “Top Teams for xG” list is led by Famalicão at 15.44, almost three times the next team, SL Benfica W at 6.57. “Victoria Premier League Womens” appears twice in the top three leagues.
The La Liga page contradicts itself once more. Its text says “Valencia CF has the worst xG” in La Liga at 1.15, while the table beside it puts Málaga last at 1.03.
What does check out is the “xG vs Actual” column. It is goals per match minus xG per match. Espanyol: 1.43 minus 1.47 gives −0.04. Barcelona: 4.43 minus 2.39 gives +2.04. We checked the whole column and every row is right.
Espanyol on FootyStats and WhoScored
Espanyol played seven La Liga matches before the international break, the last on 18 September. That lets us compare two sites on the same seven games.
On FootyStats, Espanyol's xG is 1.47 per match: 1.62 in four home games, 1.27 in three away. That makes about 10.3 in total. The goals list adds up to 10.
On WhoScored, the La Liga team xG table gave Espanyol 10.07 xG and 9 in its goals column, which is marked with an asterisk. Rayo Vallecano shows the same pattern: about 10.2 on FootyStats against 9.94 on WhoScored, with 11 goals on both.
Why so close, if the formulas differ? A team that takes many shots usually takes some good ones too, and seven matches even out single games. Between players the gap is far bigger, as the Barcelona numbers show.
FootyStats xG is still useful on its own scale. On the Nations League page, Turkey's xG was 1.90 per game against 1.50 goals scored. Italy's was 1.88 against 1.90. By FootyStats' own measure, Turkey has been finishing below its chances.
Corners and cards behind Premium
Every corner and card table on the Stats tab was locked for us, on a Nations League match between two big teams. Total corners, team corners, cards, cards per half. Each shows a padlock and “Data for Premium members only”.
The Predictions tab of the same match shows some of those numbers anyway: over 10.5 corners in 60% of recent games, over 11.5 in 50%. The Odds tab lists corner prices from 1xBet, Betfair and Pinnacle for free.
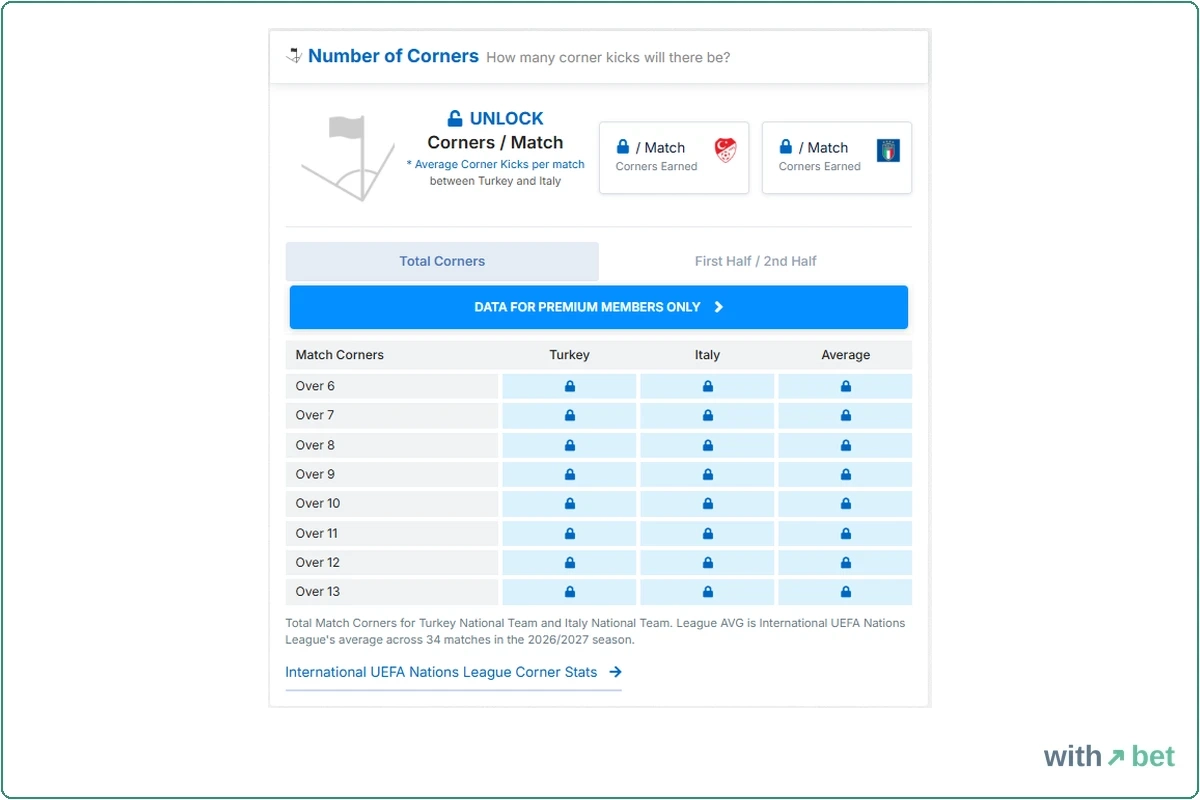
A banner between the blocks reads “Upgrade to Premium! Extra 300 Profitable Leagues. + Corner Stats & Cards”. Its smaller text promises leagues “known to be profitable and less tracked by the bookies”. The page gives no evidence for either claim.
The free side is still wide. Shots per match, shots on target, conversion rate, offsides, free kicks, goal kicks and throw-ins are all open, with over/under lines for each. Cards per 90 minutes for single players are open too, even with team cards locked.
The site's Academy leads with a featured tutorial called “Betting on Corners”, teaching a market whose numbers need Premium. For corner counts on a single match, FotMob shows them for free.
Who writes the predictions?
FootyStats gives three different answers, in three different places.
The Predictions page header says they are “AI and machine-learning based”, calculated from statistics, implied probabilities and market odds. The text beside the list says they come from high-performing users, recent user picks, and “statistical analysis generated by the FootyStats team”. The Terms say predictions “are made entirely by 3rd party users” and “are not suggestions”.
Users do make picks. A free account comes with 1,000 virtual coins, a record, a win rate and an ROI line, and any H2H page lets you place a prediction. There is a leaderboard.
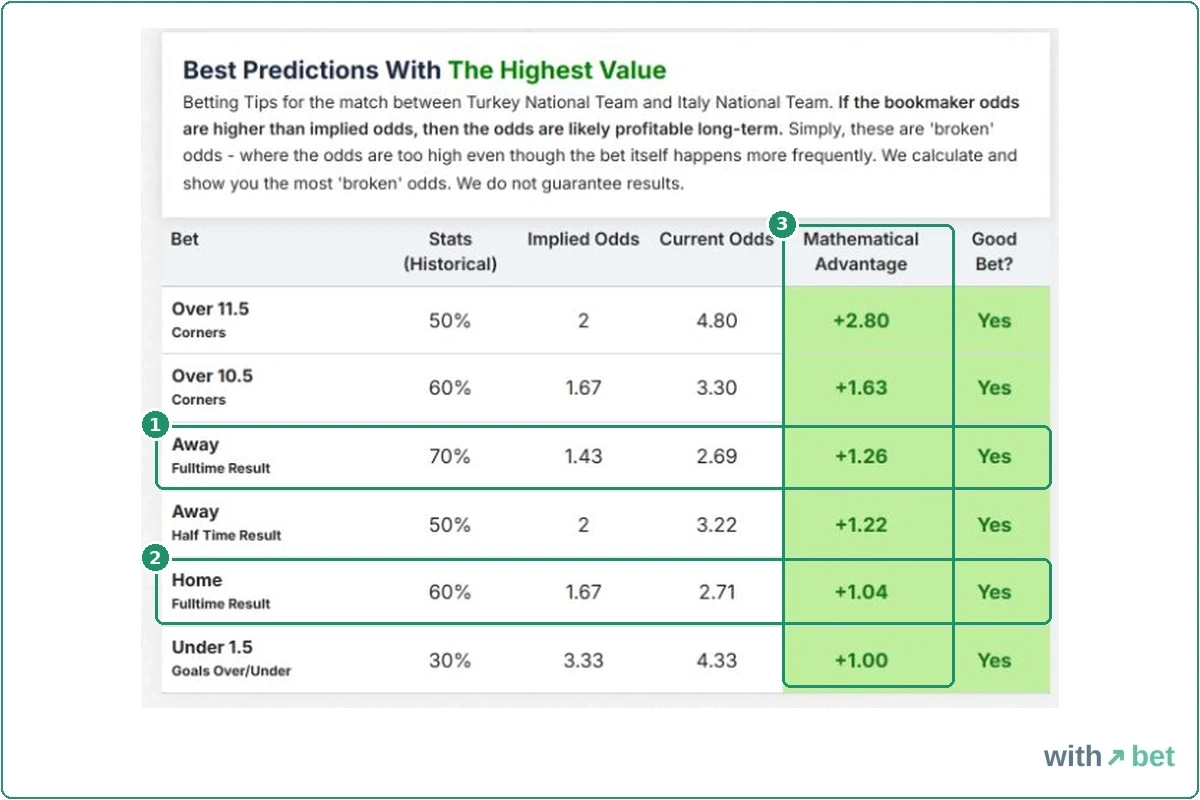
Each match also has its own Predictions tab, with a table called “Best Predictions With The Highest Value”. It compares a team's past record with the best price and marks a “Good Bet?”. For Turkey v Italy, both “Home” (60%, best price 2.71) and “Away” (70%, 2.69) were marked “Yes”. The column called “Mathematical Advantage” is the price minus a price made from the record: 2.69 minus 1.43 gives +1.26.
It is the same mistake as in the Odds Market box. Turkey's 60% and Italy's 70% come from different games against different teams, so they cannot both be the chance of this match.
Then look at one day's list on the main Predictions page. For Necaxa v América it showed Under 2.5 at 2.05, Over 2.5 at 1.66 and Away Win at 2.06. For Columbus Crew v Inter Miami it showed Home Win at 2.62 and Away Win at 2.15.
In each of those pairs, one pick has to win. On Columbus v Inter Miami, only a draw beats both. Under the list, an email box promises “5 free user posted tips everyday. Profit tracked!”
Complaints on Trustpilot follow the same line. Some users say the daily emails report profits that did not match the picks they had received.
How many leagues FootyStats really covers
The home page, the Leagues menu and the API all say 1500+. Older figures from the same company were much smaller. A university alumni page from 2018 described the big European leagues plus 200 more. An AlternativeTo listing, added by the FootyStats account itself, still says “over 60” leagues and cups. The Premium banner adds “300” extra leagues on top of the free ones.
The Spanish list alone holds La Liga, two Segunda divisions, eighteen Tercera groups, several promotion play-offs, women's divisions and five cups. The countries menu counts 27 competitions for Argentina and 8 for Albania. The Academy's “Top BTTS Leagues” box listed “Esoccer Battle”, a virtual football series played on a video game.
The 1500 counts competitions. How many of them a bookmaker actually prices is a smaller number, and one of the site's own featured reviews says so: a user notes that some FootyStats leagues are not offered at his bookmaker at all.
Premium price and the discount maths
The Premium page showed us £19.99 a month under the heading “Limited Price for Netherlands”, so the price depends on the country you view it from. Above it, £26.99 is crossed out, and the badge says “SAVE 35%”.

The maths: (26.99 − 19.99) ÷ 26.99 = 0.26. A real 35% off £26.99 would be about £17.54.
The yearly plan is labelled “20% OFF” and costs £199.99, or “Only £0.54 per day”. Twelve months at £19.99 come to £239.88, so the real saving is 17%. A 20% cut would give £191.90.
Checkout takes cards, PayPal, Apple Pay and Google Pay. Its headline promises “Profitable Predictions, Corner Stats, Card Stats, and CSVs”.
What you actually get, according to the site: corner and card tables, the extra leagues, CSV downloads, and match pages without the four-hour lock.
CSV credits, refunds and the API
CSV downloads are locked on a free account. Premium includes 100 per month, and extra credits can be bought.
The refund rules contradict each other on the same page. The subscription terms allow a refund within 3 days of the first purchase, for card and PayPal payments only, while renewals and one-time payments are non-refundable. Further down, the general Terms of Use say: “All purchases are non-refundable.”
The Contact section adds a line worth reading before you pay. “We do not respond to all emails. Those with urgent or payment related issues will be prioritized.”
The API is a separate subscription:
- Free: Premier League only, 180 requests an hour
- Hobby: £29.99 a month, 50 leagues of your choice, 1,800 requests an hour
- Serious: £69.99 a month, 150 leagues, 3,600 requests an hour
- Everything: £389.99 a month, all 1500+ leagues, 4,500 requests an hour
The spec box next to the price list says “60 — 90 Requests / Min”. Hobby works out at 30 a minute. The same box says results update every 20 minutes, while the About page says the database updates “once a minute”.
Is FootyStats legit?
Yes. A named company with a Canadian address runs it, a known payment firm sells the subscription, and the terms explain cancellation, refunds and CSV limits.
Two statements in the terms work in the reader's favour. FootyStats says it shows no third-party advertising, gives no affiliate links and does not promote bookmakers. The footer adds that the site uses no marketing or tracking cookies. We saw no bookmaker banners on any page.
The weak spots are in the paperwork. The general Terms of Use were last updated on 4 February 2022. Their arbitration clause still has two blanks from a template: “The number of arbitrators shall be __________”, and the language of the proceedings is left blank too. Then there are the two refund rules and the three explanations of who writes the predictions.
The terms promise less than the sales pages: no suggestions, no guaranteed coverage, no refund after three days.
A pre-match check with FootyStats
With only a few match pages before a four-hour wait, the order of clicks matters. This routine gets the most from a free visit.
- Start on the league page, not the match. League pages are not limited. The Over 2.5 and BTTS tables there show every team's record for the season in one list.
- Check the xG table on the league page. Look at “xG vs Actual”. A team scoring well above its xG may be riding luck, but remember this is FootyStats' own xG, so compare teams inside FootyStats only.
- Open the match once, and read the sample first. Before any percentage, see how many games it covers. For national teams it is the last 10, friendlies included.
- Use the team tables, not the coloured bars. The Overall, Home and Away columns hold the right figures. The bars above them can mix the labels.
- Convert the price yourself. Put the bookmaker's price into the odds converter and compare the percentage with the team's record. Skip the Stats column in Odds Market, which shows win rates.
- Check corners elsewhere. Without Premium, take corner counts from FotMob, one match at a time.
FootyStats against Understat, FotMob and WhoScored
Understat is the cleanest xG source among the free sites, with a classic shot model, season tables and no limits, but it covers six leagues. FotMob gives Opta xG for each shot, plus free corner counts, one match at a time. WhoScored adds a season team xG table on its league pages, also on Opta data. SofaScore sits close to FotMob in what it offers.
Where FootyStats is ahead is breadth. It is the only one of the four that turns results into over/under percentages for shots, offsides and throw-ins, and it prints some form of xG for leagues the others never reach.
Trust in the numbers is the weak side: a separate xG metric, labels that slip, predictions on both sides of one match, and a handful of free match pages before a four-hour wait.
Our rating is 3.3, below WhoScored at 3.8 and FotMob at 4.1. For a goals market in a lower league, FootyStats is often the only free page with numbers at all. For xG research, use it inside its own world and check the big leagues on an Opta site. Our stats hub and the page on FBref alternatives map which site holds which numbers.
Frequently asked questions
Is FootyStats free?
How much is FootyStats Premium?
Is FootyStats xG accurate?
Are FootyStats predictions reliable?
