Forebet predictions checked against bookmaker odds
Forebet gives free win, draw and loss percentages for thousands of matches every week. For this Forebet review we checked 2,699 of its predictions against the odds printed beside them.

Pros
- Free with no account
- Over 850 football leagues
- Past predictions stay public
- A percentage for every outcome
Cons
- Draw picks badly overrated
- Odds source never named
- No company name on site
- Bookmaker odds proved more accurate
In short:
- Free, with no account and no paid plan.
- The same stake on every prediction lost 6.1% of the money. Draw predictions lost 14.9%.
- When the site and the bookmaker's odds disagreed, the odds were usually closer to the result.
- Goals predictions (over/under 2.5 and both teams to score) lost too, by 5.7% and 7.0%.
What Forebet is and who runs it
It is a football predictions website, online since 2009. It covers football and twelve other sports. You need no account, and nothing on the site costs money.
How many leagues? It depends on which page you read. The site's search description says “more than 800 leagues”, the About text says more than 850 football leagues, and the “What is Forebet” page says 2,400 leagues across all sports. That page also promises “2,250+ games every single week”. On the day we checked, the weekend football list alone held 2,355 predictions.
The site does not say who runs it. The terms of use, the privacy policy and the “What is Forebet” page mention only “Forebet.com”. A company name appears in one place, the App Store, where the seller of the Forebet app is FORE CREATIONS EOOD. EOOD is a Bulgarian form of limited company.
The money comes from advertising. The privacy policy names Google AdSense and Criteo on the website and Google AdMob in the Android app.
One line in the terms stands out. It says the information is “not intended for betting, wagering, or gambling purposes”. Yet every prediction sits next to bookmaker odds, and the Values page picks bets with a formula that tells you how much to stake.
How Forebet calculates its predictions
Forebet says its numbers come from “the Poisson Distribution, the Beyond Poisson, and more”, run by “a proprietary algorithm that processes thousands of variables”. Poisson is a standard formula. It turns the number of goals a team is expected to score into a chance for every possible score. Our xG guide shows it working on one match.
The inputs the site names are recent form, home advantage and head-to-head records. The model itself is not published.
The method is described in three different ways:
- The FAQ says the predictions are “based entirely on a statistical and mathematical analysis” and that no human input changes them.
- The terms of use say they are based on “mathematical models and subjective analysis”.
- The App Store listing calls them “AI-driven”.
“No human input” and “subjective analysis” are two different claims. The site makes both.
Reading a Forebet prediction row
The main tab is called 1X2, the betting name for the three results of a match: 1 is a home win, X a draw, 2 an away win. Every match gets one row. From left to right:
- Prob. %: the site's chance of a home win (1), a draw (X) and an away win (2). The three add up to 100.
- Pred: the result with the highest percentage.
- Correct score: the single most likely score.
- Avg. goals: how many goals the model expects in the match.
- Coef.: the odds for the result in Pred.
- Score and Live coef.: the final score, and the odds during the match.
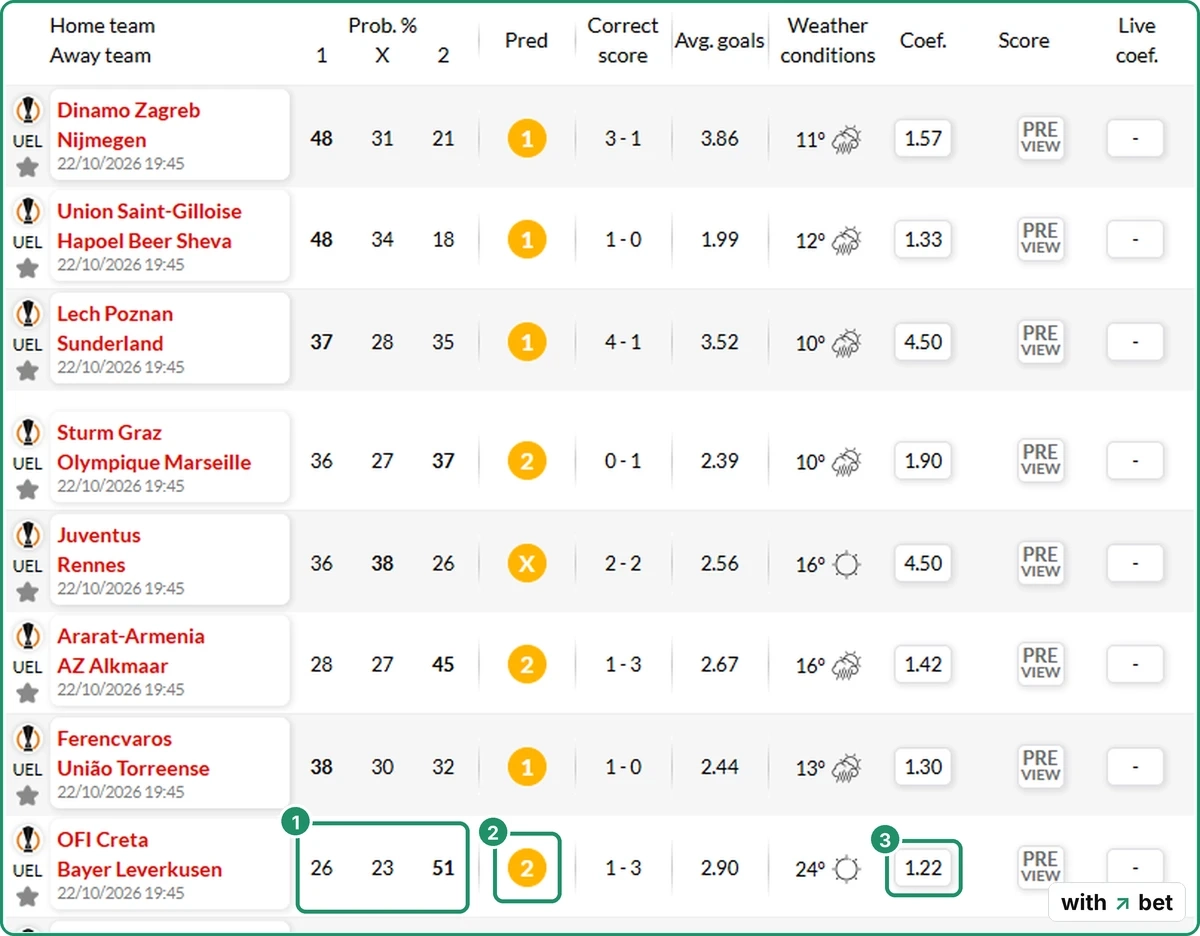
Coef. is the column that matters. It shows the odds for the predicted result, not for the home team. We checked this on 2,699 matches: low odds sat next to picks the site was sure about, high odds next to doubtful ones. Which bookmaker the odds come from is not stated anywhere, not in the tables, on the match pages or in the FAQ.
Odds of 2.00 mean a $10 bet returns $20 if it wins: your $10 back plus $10 profit. Odds also hide a percentage. Divide 100 by the odds and you get the bookmaker's chance for that result. Odds of 2.00 mean 50%. Odds of 1.25 mean 80%. Our odds converter does it for any format.
So every row carries two percentages: the site's own, and the bookmaker's. A bookmaker that sets wrong prices loses money, which makes its numbers a tough benchmark. Most of this review is about which of the two was right.
How we tested Forebet predictions
The site keeps old predictions with the final score next to each one. Green means the prediction was right, red means it was wrong. Any past day opens from the calendar.
We copied every 1X2 prediction for five days: 16, 17, 18, 19 and 21 October 2026. That gave 3,486 finished matches. 2,699 of them had odds in the Coef. column, and those 2,699 became the test.
The rule was simple. One unit on every prediction, at the odds shown in the row. A unit is a fixed stake, the same every time: $10, say, or 1% of your betting money. Matches that were postponed, cancelled or awarded without being played were left out. When a match went to extra time or penalties, we used the score after 90 minutes.
The weekend gave most of the sample: 2,075 of the 2,699 bets came from 17 and 18 October. Weekdays simply have fewer matches with odds. The Under/Over and BTTS test used the same five days and the same rule, and has its own section below. We ran the same kind of test on an AI tips site in our NerdyTips review.
Forebet accuracy by home, draw, away
The tables below use the same columns. “Won” is how often the prediction came in. “Forebet's average” is the chance the site gave those predictions. “Odds implied” is the bookmaker's chance, 100 divided by the odds. “Return” is profit or loss as a share of the money staked: −6.1% means $6.10 lost for every $100 bet.
| Prediction | Bets | Won | Forebet's average | Odds implied | Return |
|---|---|---|---|---|---|
| Home win (1) | 1,178 | 56.4% | 47.9% | 58.5% | −2.2% |
| Away win (2) | 931 | 45.3% | 47.3% | 48.9% | −5.3% |
| Draw (X) | 590 | 25.3% | 42.0% | 29.4% | −14.9% |
| All predictions | 2,699 | 45.8% | 46.4% | 48.8% | −6.1% |
The prediction was right in 45.8% of the 2,699 bets. At one unit a bet, that lost 164 units, or 6.1% of the money staked.
Is that bad? Bookmakers build a margin into their odds, a small cut on every bet. So anyone who is not more accurate than the bookmaker loses a few percent over time. These predictions did not beat that margin.
Home picks did best, with a loss of 2.2%. They won 56.4% of the time, close to the 58.5% the odds expected. The model itself had given those home teams only 47.9% on average.
We also split the bets by league. The top divisions of England, Spain, Italy, Germany, France, the Netherlands, Portugal, Belgium, Turkey, Brazil, Argentina, the US and Mexico, plus the Champions League, gave 125 bets. They finished at +0.5%, roughly where they started. And 125 bets is far too few to call Forebet reliable there. Other top divisions lost 10.8% on 616 bets. Lower divisions lost 6.8% on 1,434 bets. The other 524 bets came from cups and from women's, youth and regional competitions.
Draw predictions are the weak spot
The site predicted a draw 590 times. It gave those draws an average chance of 42%, and only 25.3% of them ended level.
The odds said 29.4%, four points too high. The site was almost seventeen points too high. Betting every draw prediction lost 14.9% of the stake.
Across all 3,486 matches in our sample, 23.8% ended in a draw.
A draw prediction usually appears when the model sees two even teams. The odds on a draw are high, often between 3.00 and 4.00. Next to a 42% chance they look like a bargain: odds of 3.50 mean the bookmaker sees only 29%. In our test, draws were the worst bet on the site.
Forebet gave its draw predictions a 42% chance. 25% of them ended level.
Forebet against the bookmaker's odds
The two percentages on a row often disagree by a lot. Say the site gives a team 45% and the odds of 1.43 mean 70%. The odds are then 25 points more confident. We split all 2,699 bets by the size of that gap. The table leaves out bets with a gap of 3 to 10 points. With gaps that small, the picture was mixed: each side was closer in one of the two groups.
| When they disagreed | Bets | Forebet said | Odds said | Actually won |
|---|---|---|---|---|
| Odds 20+ points more confident | 399 | 46.7% | 75.2% | 69.7% |
| Odds 10–20 points more confident | 483 | 47.4% | 62.2% | 60.5% |
| Almost the same (within 3 points) | 330 | 47.4% | 47.3% | 40.6% |
| Forebet 10–20 points more confident | 491 | 44.9% | 30.6% | 28.5% |
| Forebet 20+ points more confident | 171 | 51.0% | 24.8% | 32.2% |
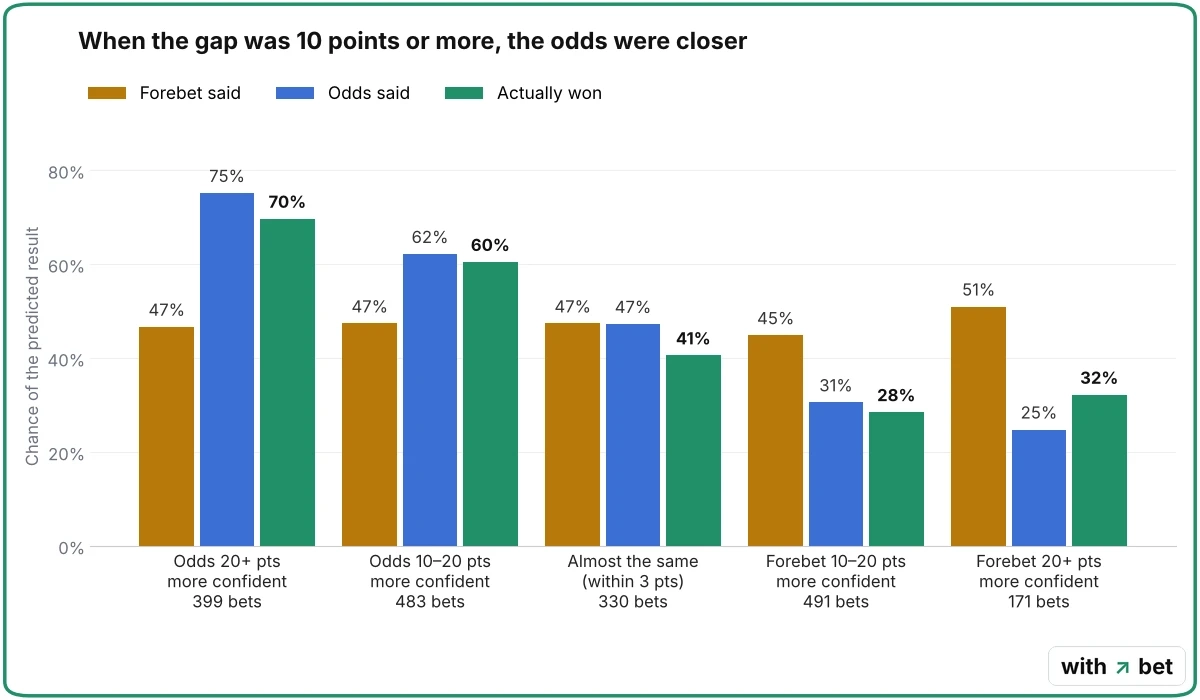
Take the top row. When the odds were 20 or more points more confident than Forebet, the team won 69.7% of the time. The site had said 46.7%.
Now the fourth row. Here the model was 10 to 20 points more confident than the odds, and the team won 28.5% of the time. The odds had said 30.6%.
When the gap was 10 points or more, the odds were closer to what happened in every group.
The site's percentages also stay close to the middle. On the 1X2 tab it almost never gives a result more than 75%. Yet the teams it rated at 70% or more won 83.3% of their matches, and the odds had said 76.3%. Clear favorites look weaker on the site than they are.
Teams Forebet rated at 70% or more won 83% of their matches.
One group made money, and it needs a warning. In 171 bets the site was at least 20 points more confident than the odds, and these bets made a profit of 31%. The odds were still closer to the result there: 24.8% against Forebet's 51.0%, with 32.2% actually won. Many of them come from amateur and regional leagues, at odds that look wrong for the match. One Austrian regional game had Forebet at 70% for the away team, with odds of 6.50 beside it. We think many of these are errors in the Coef. column, odds no bookmaker really offered. And 171 bets is too few to draw any conclusion.
When Forebet and the odds disagreed by 10 points or more, the odds were closer to the result in every group.
Values and Top predictions tested
A value bet is one where the chance of winning is higher than the odds suggest. Values is the site's list of such bets, picked “by the Kelly Criterion”. The Kelly criterion is a formula. It compares your chance with the odds and tells you what share of your bankroll to stake. Your bankroll is the money you keep for betting. Our Kelly criterion guide explains it step by step.
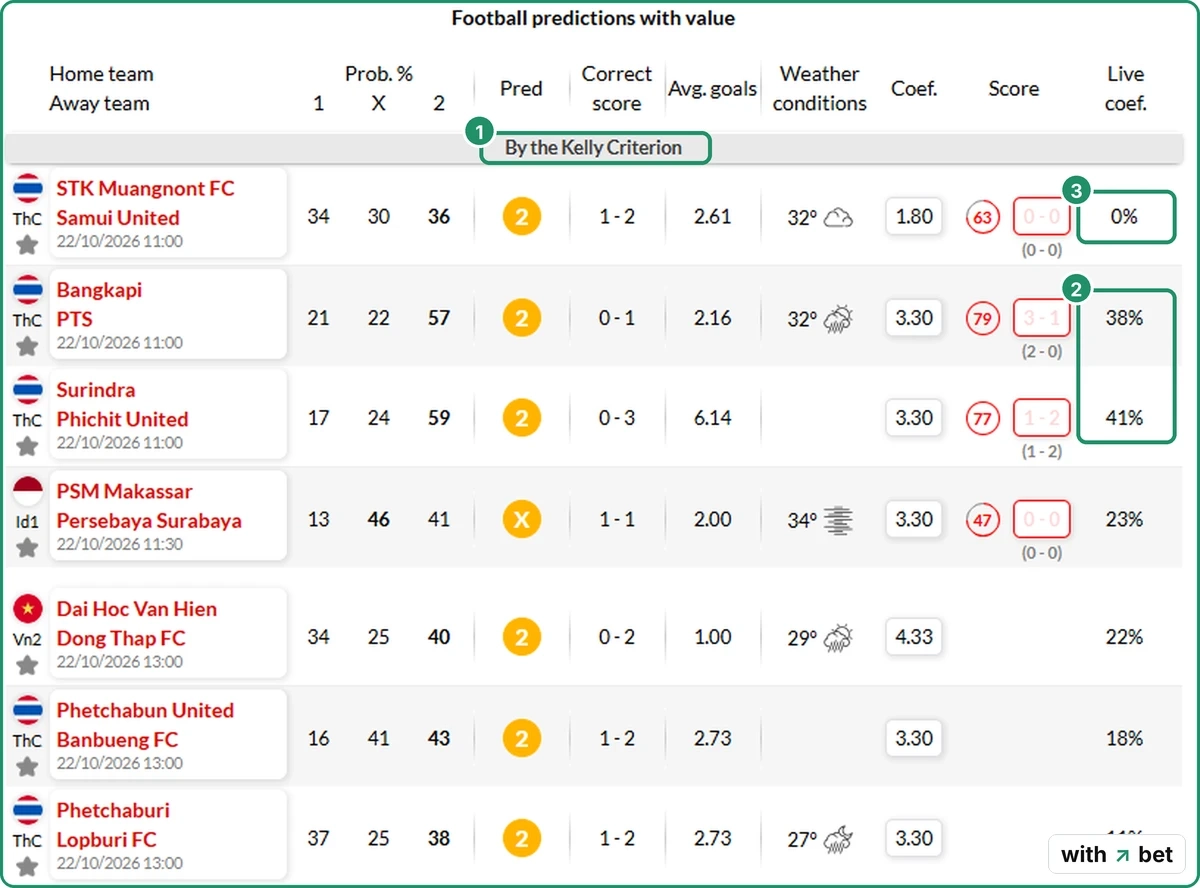
Two things on this page are easy to miss.
The last column is labelled “Live coef.”, but on the Values page it shows the full Kelly stake as a percentage. On the day we looked, it went up to 41% of the bankroll on a Thai FA Cup match. Staking the full Kelly figure is risky even when your chance is right. A few losses in a row can wipe out half the bankroll. Most bettors who use Kelly stake a quarter of the figure or less.
Some rows show 0%. By the site's own numbers, these are not value bets at all. To check a value bet, multiply the site's chance by the odds. Above 1, the bet is value. STK Muangnont against Samui United shows the away team at 36% with odds of 1.80. 0.36 × 1.80 = 0.65, well below 1.
We applied the same test to our data. That gave 1,278 bets. They won 31.8% of the time and lost 4.9%. Almost half of them, 585, were draws, and those lost 15.4%. The other 693 made about 4%. On this many bets, a gain that small cannot be told apart from luck.
Top predictions are the matches where one result gets about 50% or more. We had 787 such bets. They won 59.3% and finished at +0.6%, close to break-even.
Correct score and average goals
The correct score was right in 263 of 3,486 matches, or 7.5%. Even the most likely score in a football match happens rarely. Treat it as a picture of the match Forebet expects: tight, open or one-sided.
Avg. goals is more useful. It is the figure the Poisson formula starts from, and the same column appears in the Under/Over 2.5 tab. Our xG guide shows how one expected-goals figure turns into a chance of three goals or more. We tested that tab too, along with Both Teams To Score.
Under/Over and BTTS predictions tested
Forebet has two more tabs for goals. With these you do not need to guess the winner.
- Under/Over 2.5. Over wins if the match has three goals or more. Under wins with 0, 1 or 2 goals. The ".5" means there is no draw: the bet always wins or loses.
- Both Teams To Score (BTTS). Yes wins if each team scores at least once. No wins if one team, or both, fails to score.
For each match the site shows a percentage for both options and picks the higher one. We tested these picks for the same five days and by the same rule: one unit on every pick, at the odds in the row.
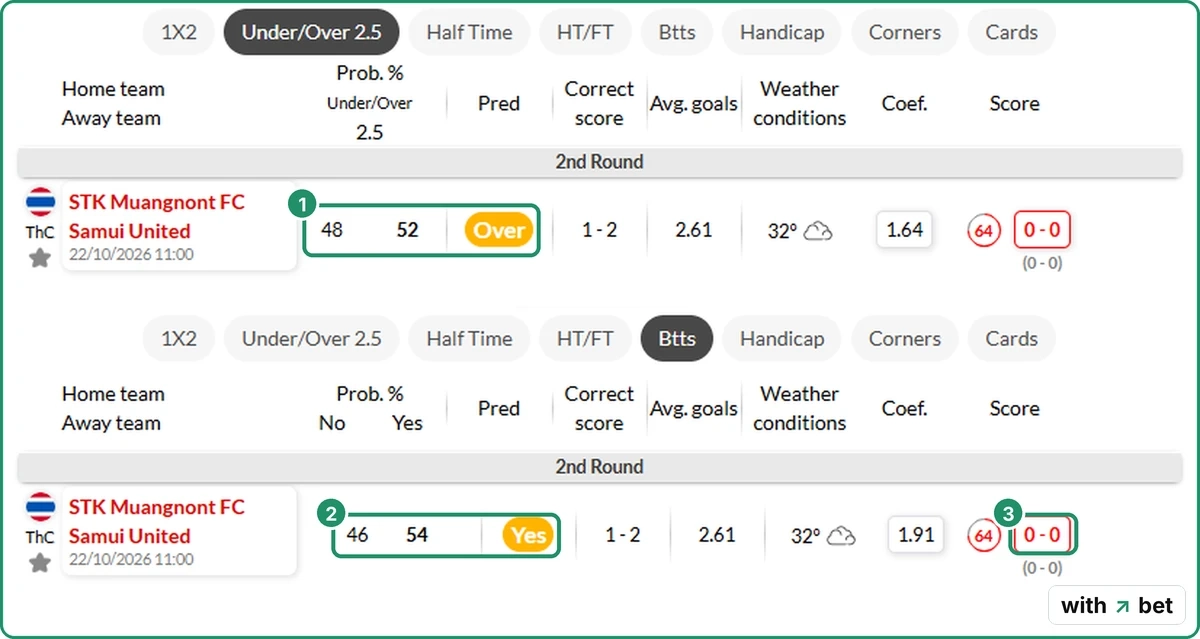
The columns mean the same as in the 1X2 table above.
| Prediction | Bets | Won | Forebet's average | Odds implied | Return |
|---|---|---|---|---|---|
| Over 2.5 | 1,170 | 58.5% | 63.2% | 60.2% | −2.9% |
| Under 2.5 | 1,166 | 49.8% | 62.6% | 54.2% | −8.6% |
| BTTS Yes | 1,349 | 58.0% | 65.6% | 60.7% | −3.6% |
| BTTS No | 952 | 46.7% | 57.9% | 53.6% | −11.9% |
| All goals picks | 4,637 | 53.8% | 62.6% | 57.5% | −6.4% |
So both tabs lost money. Under/Over lost 5.7% on 2,336 bets, BTTS lost 7.0% on 2,301. In money: someone who staked $10 on every Under/Over pick would have bet $23,360 and lost about $1,340.
Under is where Forebet was furthest off. It gave these picks 62.6% on average, yet only half of them won. Under and BTTS No are both bets on a quiet match, and they lost 8.6% and 11.9%.
On 21 October Forebet gave Under 2.5 a 78% chance in the Japanese second-division match Tegevajaro Miyazaki v Blaublitz Akita. The odds were 1.70, which means the bookmaker saw about 59%. The match ended 2-1, three goals, and the bet lost.
This happened across the sample, not in one match. Across all goals picks, the site was about 9 points too high. On the picks it rated at 70% or more, it was about 20 points too high:
| Forebet's percentage | Bets | Forebet's average | Odds implied | Actually won |
|---|---|---|---|---|
| Under/Over, 70% or more | 593 | 77.4% | 60.0% | 57.7% |
| BTTS, 70% or more | 561 | 77.8% | 63.9% | 58.6% |
A pick shown at 77% won less than six times in ten. The bookmaker's figure was much closer.
The 1X2 tab went differently. There the site gave home picks too little, away picks about the right figure and draws far too much. On goals, it rated every kind of pick too high.
Value bets did no better. These are picks where the site's percentage times the odds is above 1, the rule from the Values page. They lost too: 6.7% on Under/Over and 5.0% on BTTS. The value test uses the site's percentage, and on goals that percentage was too high.
Match pages, trends and live predictions
Click a match and it opens its own page. The page repeats the prediction and adds each team's last six matches, home and away form, a league table and the head-to-head record, the past meetings between the two teams. Our head-to-head guide explains why a few old meetings say less than they seem to.
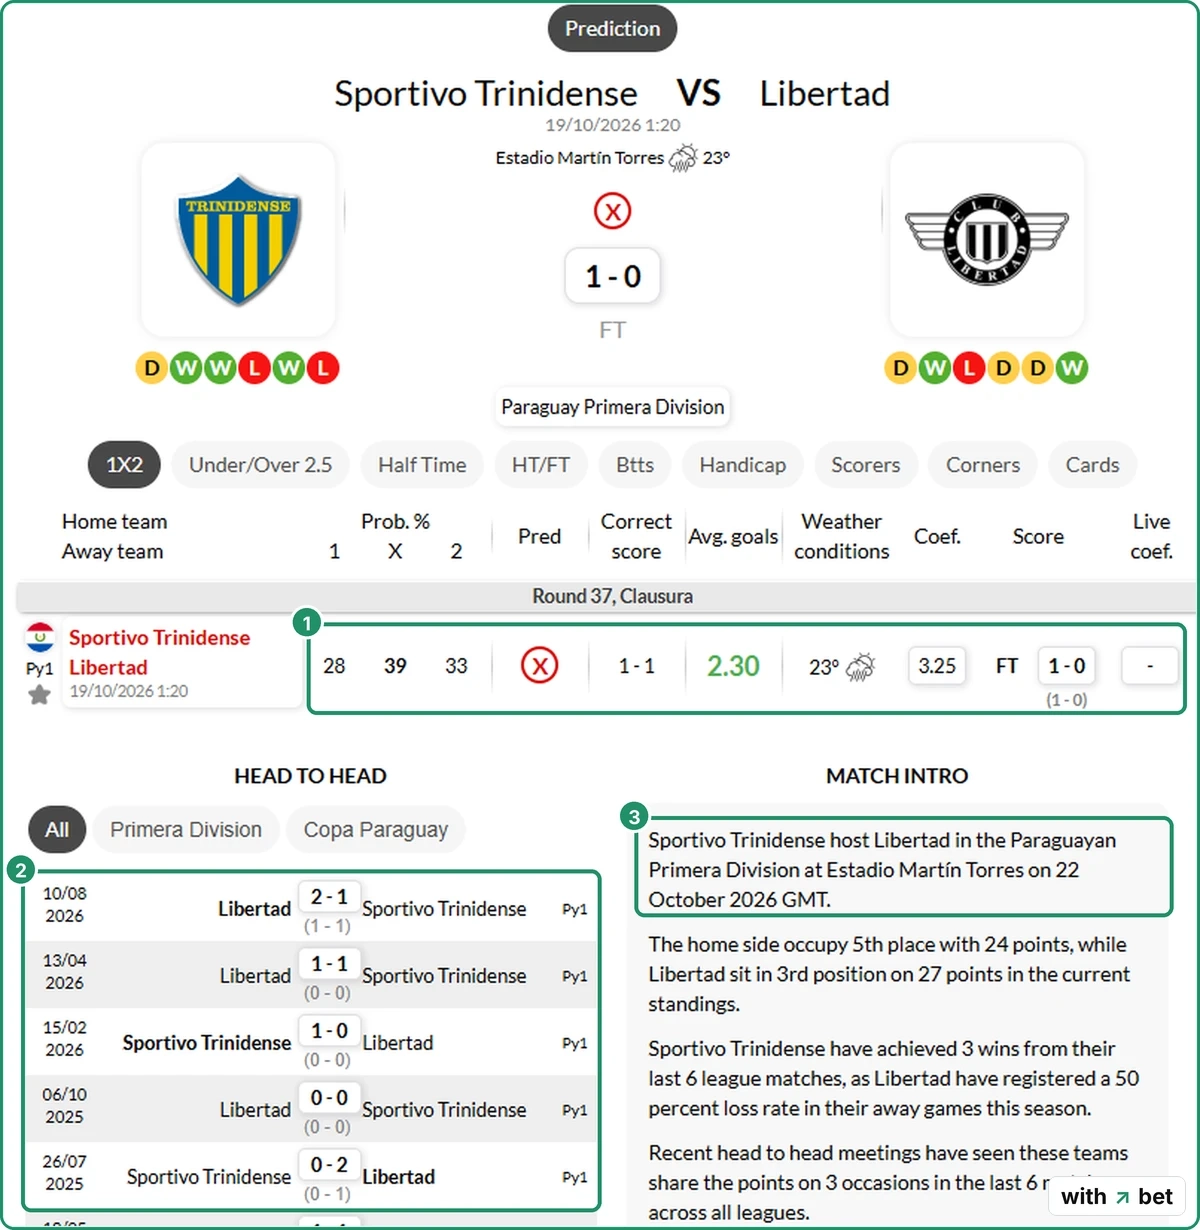
Some matches also get a “Match intro”, a short text written automatically from the stats. Sportivo Trinidense against Libertad was played on 19 October 2026. Its intro said the match would be played “on 22 October 2026 GMT”. The other facts in that intro were correct.
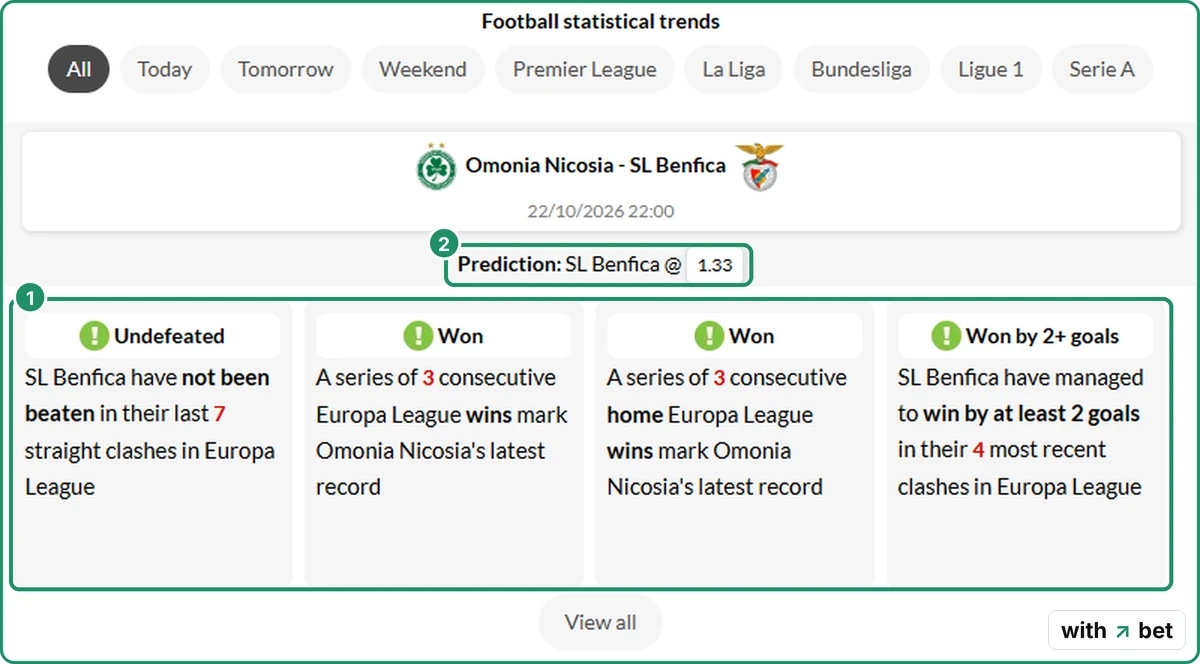
The Trends page lists short runs, such as “Won 3”, “Undefeated” or “Won by 2+ goals”. Each run comes with a pick and odds, for example SL Benfica at 1.33. Most rest on three or four matches. Bookmakers see the same runs, so they are usually built into the odds already.
Live predictions update every minute during a match. The Live coef. column then shows the odds for the predicted result as they change during the match.
Other sports, the app and scam warnings
The top menu lists 13 sports, from basketball and tennis to Australian football (AFL) and esoccer, football played on a games console. The FAQ names 10. Trends are football only, and our test covered football only.
There are free apps for Android and iPhone. The Android app shows ads from Google AdMob.
The site also has an “Avoid scam” page. It says it has no paid tips, no VIP groups, no agents and no sponsored pages. So anyone who asks you for money in Forebet's name is not Forebet. Our guide to Telegram betting tips explains how such channels earn.
Forebet alternatives
None of the sites below is a copy of Forebet. Which one to open depends on what you came to Forebet for.
| What you want | Where to go | What you get |
|---|---|---|
| Percentages for 1X2, over/under 2.5 and BTTS | OddAlerts | The same three markets free, plus 3 AI match reports a day |
| A short list of tips with a public record | NerdyTips | Seven free tips a day and a file of every tip since January 2024 |
| Expected goals (xG) | Understat, FotMob | xG for six leagues, or xG for every single shot |
| Odds from named bookmakers | BetExplorer | Prices from about twenty bookmakers on one match, no account |
OddAlerts is the closest match. A free account, opened without a card, shows win, draw, both-teams-to-score and over/under 2.5 percentages for every match. Pro costs £19.99 a month. Our OddAlerts review shows what the free model gives you and what stays locked.
NerdyTips works the other way round: seven tips a day instead of thousands of rows. Its own file lists 170,689 tips since January 2024. They won 66.9% of the time and still lost 4.2%, because at average odds of 1.46 you need about 68.5% just to break even. The full test is in our NerdyTips review.
Do you open Forebet for the Avg. goals column? Then go to a site built on expected goals. Understat covers six top leagues. FotMob shows Opta's xG for every shot in a match.
Forebet never says whose odds it prints. BetExplorer names every bookmaker in its odds table: on the Champions League match we checked, there were twenty rows. Compare its prices with the Coef. column before you trust either one.
Using Forebet without losing money
The site is a quick way to see form, head-to-head records and the model's goals estimate for a match in almost any league. The predictions are the weaker part of the site.
Before you use one of its percentages:
- Divide 100 by the odds in the Coef. column. That is the bookmaker's percentage.
- If the two differ by 10 points or more, trust the odds. In our test they were closer in every such group.
- Skip draw predictions. They lost 14.9%.
- On Under/Over and BTTS, read a 70% pick as roughly 60%. That is how often those picks won.
- Do not stake the Kelly percentage from the Values page. If you use it at all, stake a quarter of it or less.
- Check dates and facts in the auto-written texts yourself.
Our 20-minute pre-match routine shows where Forebet fits next to other free stats sites. Every stats site we have tested is on our stats and analytics page.
Frequently asked questions
Is Forebet free?
Is Forebet legit?
Does Forebet have an app?
How accurate is Forebet?
Whose odds does Forebet show?