Betting spreadsheet template for Excel and Sheets
This free bet tracking spreadsheet template works in Excel, Google Sheets and LibreOffice. Type the bet and its result, and it works out profit, ROI and CLV. It also shows ROI without free bets: 2.9% instead of 19.8% in our example.

Pros
- Handles voids, half wins and cash-outs
- Shows ROI without free-bet profit
- Splits results by odds and month
- Works in Excel, Sheets and LibreOffice
Cons
- Every bet is typed by hand
- Slow to fill in on a phone
- One currency per file
- Results never settle by themselves
Download the free bet tracking spreadsheet (.xlsx)
Download the blank version, no examples (.xlsx)
Free bet tracking spreadsheet download
Our bet tracking template is a normal .xlsx file. You do not need an e-mail address, an account or an add-on to use it. It works as a sports betting tracker for any sport and any bookmaker. Open it in one of three programs:
- Excel: open the file as it is.
- Google Sheets: open our Google Sheets version with examples or the blank Google Sheets version and click Make a copy. This step needs a Google account. The copy is saved in your own Drive, and nobody else can see it.
- LibreOffice Calc: open the file as it is. The program is free.
The formulas use only functions that all three share, such as IF, SUMIFS, SUMPRODUCT and COUNTIF. There are no macros. We recalculated every formula in LibreOffice before publishing and checked each total by hand.
You work with four sheets in the file. Read Start here first: it lists the rules in plain words. You type your bets on the Bets sheet, and the Summary sheet adds everything up and draws a chart of your profit. Your bookmakers and sports go on the Lists sheet, which feeds the drop-down menus.
The main file comes with eleven example bets, so you can see what each formula gives. To clear them, select cells A2:M12, hold Ctrl (Cmd on a Mac), add R2:R12 and press Delete. Do not delete whole rows. The grey columns hold the formulas. In Excel and LibreOffice they are protected, so the program stops you before a formula changes. A Google Sheets copy has no such lock, so take care there. The blank version has no examples and needs no clean-up.
Which columns does a betting spreadsheet need?
In this bet tracker spreadsheet, each bet is one row. Thirteen columns are for you, plus a Notes column. Four more columns are formulas, and you never type in them.
The odds are decimal, because most international bookmakers show decimal odds by default. Does your Excel show numbers like 1,95 with a comma? Then type odds with a comma too. The formulas are saved in a form that every language version of Excel and Google Sheets reads, so nothing else changes. If your bookmaker shows American or fractional odds, change them first with our odds converter. An accumulator (a parlay) goes in as one row. Type the odds of the whole slip, not of each leg.
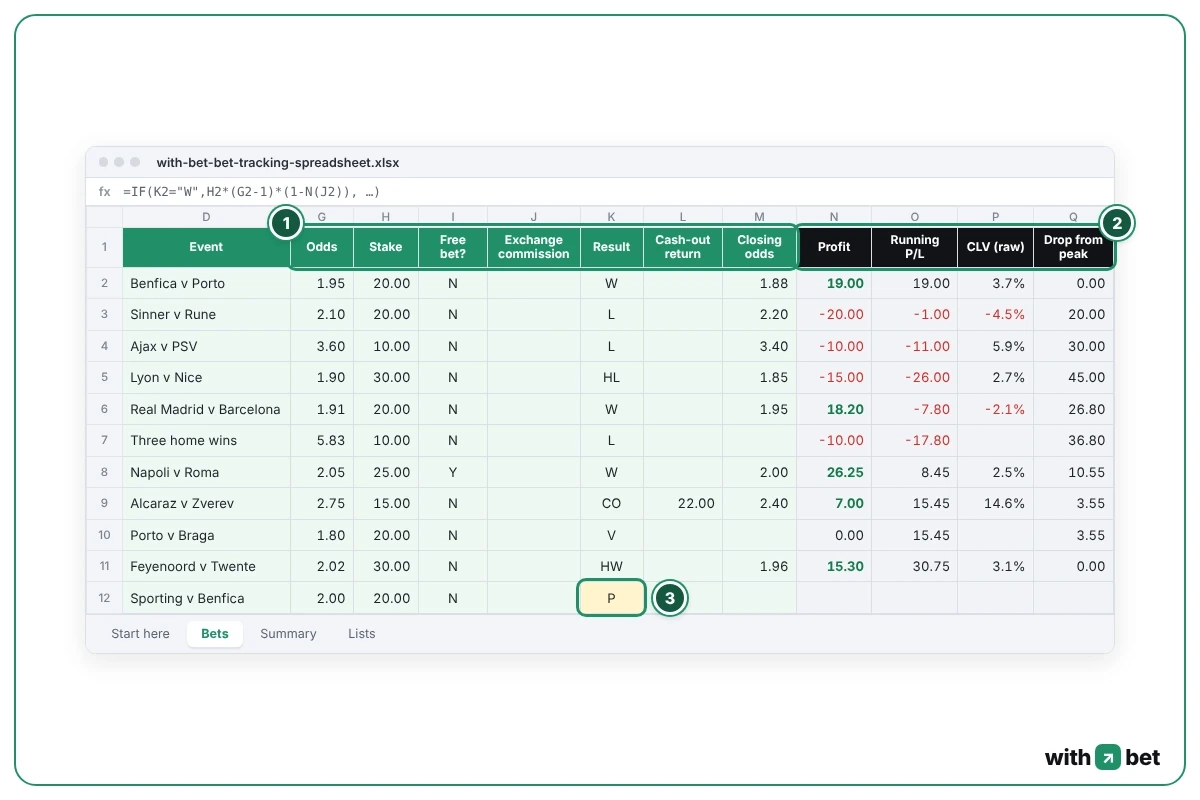
You can leave Closing odds empty. The CLV column then stays empty too, and profit, ROI and the rest still work.
Exchange commission is only for betting exchanges. An exchange is a site where bettors bet against each other, such as Betfair, and it keeps a share of every win. Type that share, for example 2%, and the sheet takes it off the profit. A stake of 20 that wins at 2.10 makes 22.00. With 2% commission it makes 22.00 × 0.98 = 21.56. For a normal bookmaker, leave the cell empty.
Logging a bet, step by step
Log the bet the moment you place it. Later you will forget the exact price.
Fill in the date, bookmaker, sport, event, market, bet type, odds and stake. The market is what you bet on, for example “Over 2.5 goals” or “Draw”. Set Result to P for pending. Bookmaker, sport, bet type and result are drop-down menus, so a typo cannot split one bookmaker into two names.
Before kick-off, look at the price once more and put it into Closing odds.
When the match is over, change P to the result code. Profit, running P/L and every number on the Summary sheet update at once.
Download the free bet tracking spreadsheet (.xlsx)
Void, half win, cash-out and free bets
A tracker with only “won” and “lost” cannot record every bet. The template has seven result codes:
| Code | Type it when | Profit on 10 at 2.00 |
|---|---|---|
| W | The bet won | +10.00 |
| L | The bet lost | −10.00 |
| V | Void or push: the bet is cancelled and the stake comes back | 0.00 |
| HW | Half won on an Asian handicap line ending in .25 or .75 | +5.00 |
| HL | Half lost on such a line | −5.00 |
| CO | Cash-out: the bookmaker bought the bet back. Type the amount in Cash-out return | Amount minus 10 |
| P | The bet has not settled yet | Not counted |
An Asian handicap gives one team a head start in goals. A line that ends in .25 or .75 splits your stake into two halves. One half can win or lose while the other comes back. A free bet is not a code. It has its own column: set Free bet to Y when the bookmaker gave you the stake.
The example log uses them in five rows:
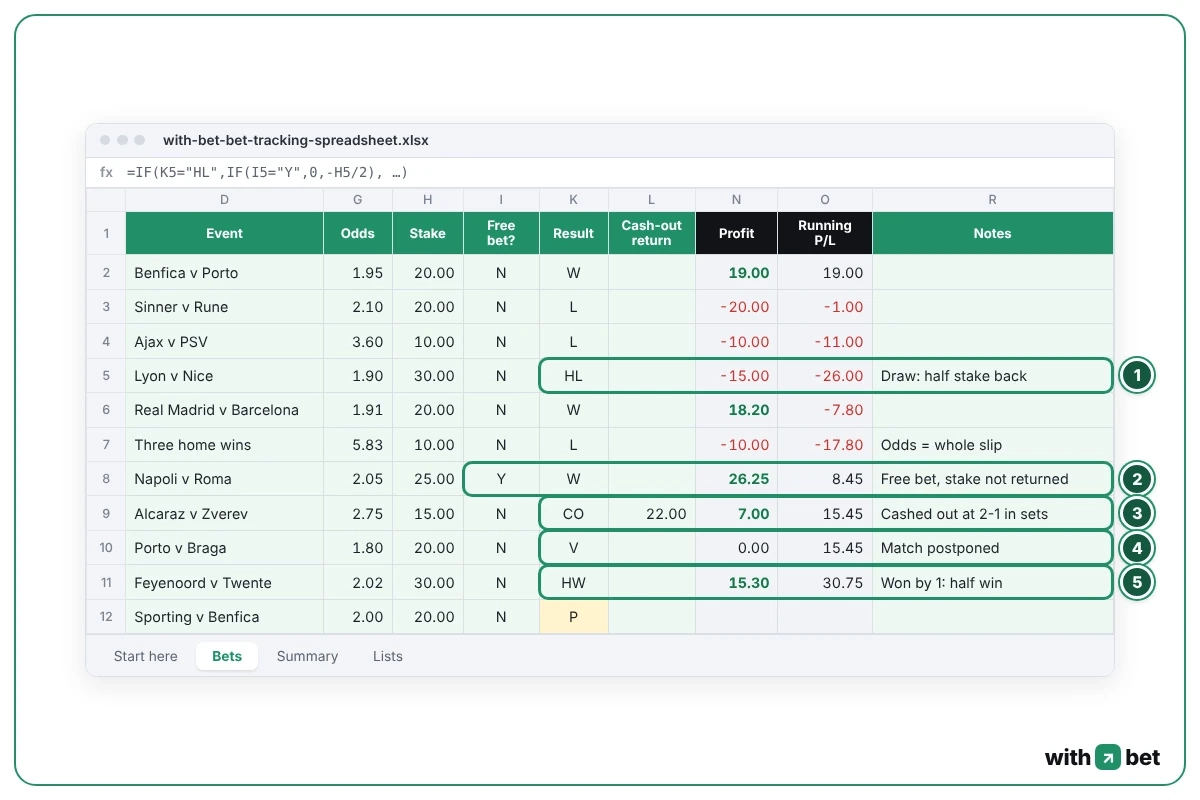
Take the Lyon bet: −0.25 at 1.90 with 30 staked, and the match ended in a draw. Half the stake loses and half comes back, so the code is HL and the profit is −15.00.
Napoli was a free bet, so Free bet is set to Y. A win at 2.05 on a 25 free bet pays 25 × 1.05 = 26.25. A losing free bet costs 0.
Zverev was cashed out for 22 on a stake of 15. Code CO, then type 22 in Cash-out return, and the profit is 7.00. A cash-out counts in profit and in ROI. It stays out of the win rate, because the bet never won or lost. In our Zort review, the app filed a cashed-out bet as still open, so it never reached the win rate.
And a match that never starts? Porto v Braga was postponed. Code V gives a profit of 0, and the bet stays out of both the win rate and ROI. Feyenoord −0.75 at 2.02 with 30 staked won by one goal, so half the stake wins and half is returned: 15 × 1.02 = 15.30.
The formulas behind profit and ROI
To track bets in Excel or Google Sheets, five formulas do the main work:
- Profit formula for a win: stake × (odds − 1). Row 2: 20 × 0.95 = 19.00.
- Running P/L (profit and loss): the sum of all profits up to that row.
- ROI (return on investment) formula: net profit ÷ own money staked. Here 30.75 ÷ 155 = 19.8%.
- Win rate: wins ÷ (wins + losses). A half win counts as a win, a half loss as a loss. Here 4 ÷ 8 = 50%.
- Drop from peak: the highest running P/L so far minus the current one. Bettors call this the drawdown.
Building your own sheet instead? These are the same five, plus CLV, written for the template's columns. G is odds, H is stake, I is free bet, K is result, M is closing odds, N is profit and O is running P/L. Put them in row 2 and copy them down:
- Profit on a won bet: =H2*(G2-1)
- Running P/L: =SUM($N$2:N2)
- CLV: =G2/M2-1
- Drop from peak: =MAX(0,MAX($O$2:O2))-O2
- ROI: =SUM(N2:N2001)/SUMIFS(H2:H2001,K2:K2001,"<>",K2:K2001,"<>P",K2:K2001,"<>V",I2:I2001,"<>Y")
- Win rate: = (COUNTIF(K2:K2001,“W”) + COUNTIF(K2:K2001,“HW”)) / (COUNTIF(K2:K2001,“W”) + COUNTIF(K2:K2001,“HW”) + COUNTIF(K2:K2001,“L”) + COUNTIF(K2:K2001,“HL”))
In an Excel that uses a decimal comma, write semicolons between the parts of a formula instead of commas.
“Own money staked” counts settled bets only. Voids and free bets are left out, because none of your money was at risk on them.
The tables by bookmaker, sport, bet type, odds range and month divide each group's profit by that group's own stake. In our mybets.gg review the app divided football profit by the stake on all sports and printed 26.3%. The real football ROI was 35%.
Some bettors think in units. Type your unit size on the Summary sheet and the sheet shows profit in units too. With a unit of 10, a profit of 30.75 is 3.08 units. If you want a rule for the size of the unit itself, our Kelly criterion guide explains one.
Can one free bet fake ROI?
Look at the example log. Net profit is 30.75 and ROI is 19.8%. That looks like a strong month.
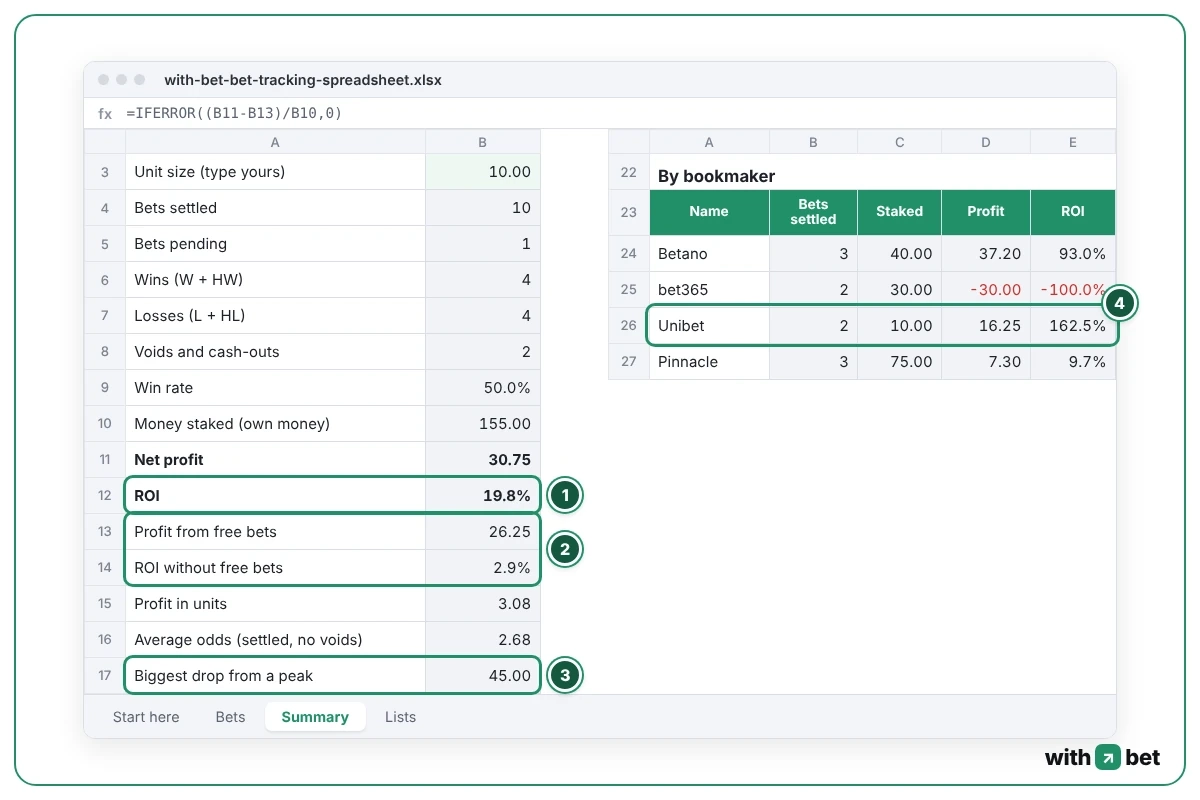
Now read two lines lower. 26.25 of the 30.75 came from a single free bet. Take it out and 4.50 of profit is left, so ROI without free bets is 2.9%.
The same thing shows up by bookmaker. Unibet reads 162.5% on two bets. One lost 10, the other was the free-bet win of 26.25, and the free bet adds nothing to the stake. So 16.25 of profit is divided by 10.
A single free-bet win of 26.25 moved this example log from 2.9% ROI to 19.8%.
You can withdraw a free-bet win like any other money. Still, the stake came from the bookmaker. Do your own picks make money? ROI without free bets answers that.
Biggest drop from a peak is 45. The log was up 19 after the first bet and down 26 three bets later. The total climbed back to +30.75 by the end, and the 45 still stays on the sheet.
Closing odds and CLV in a spreadsheet
Closing odds are the last price before the event starts. CLV (closing line value) compares your price with that last price. The formula is your odds ÷ closing odds − 1.
Benfica v Porto was taken at 1.95 and closed at 1.88. That is 1.95 ÷ 1.88 − 1 = 3.7%. The price dropped after the bet, which means the market moved toward your side.
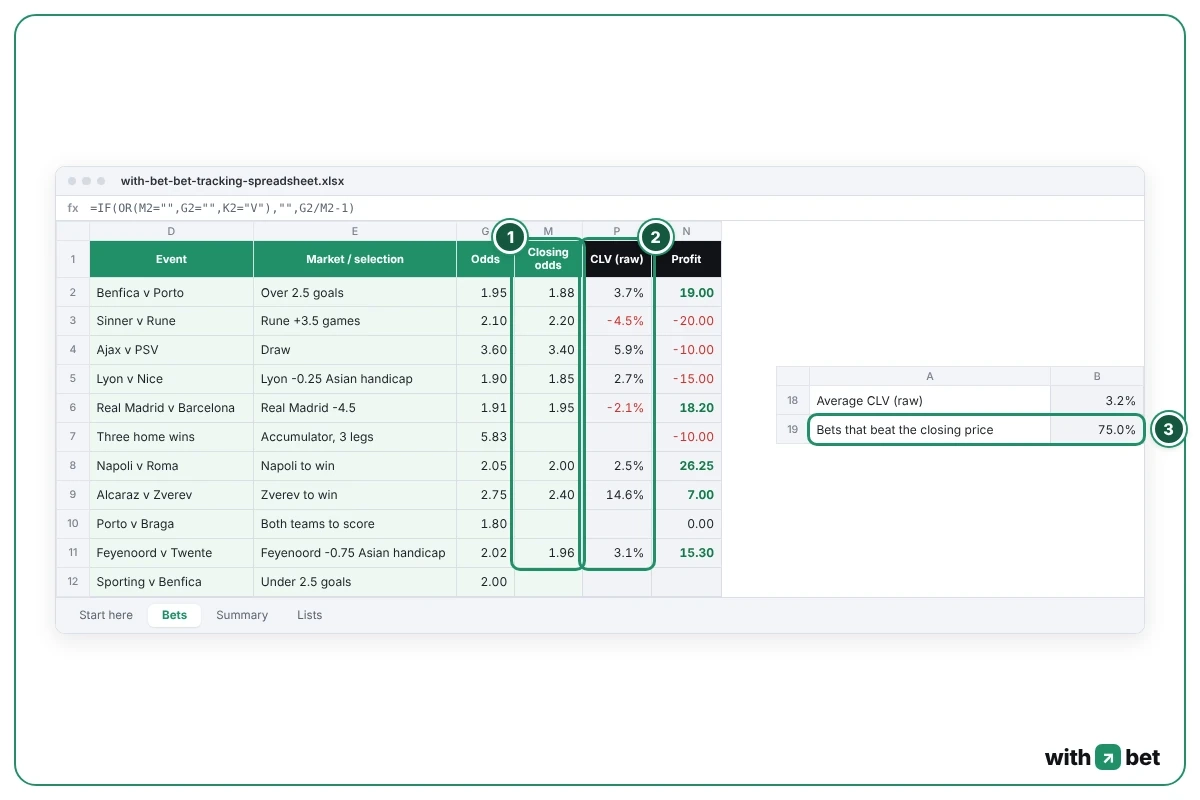
In the example, six of eight bets beat the closing price. The average CLV is 3.2%.
This is the raw number. The bookmaker's margin, its built-in fee, is still inside the closing price. This makes raw CLV read higher than your real advantage over the market. Our closing line value guide shows how to take the margin out.
How many bets make ROI reliable?
How many bets do you need before ROI shows real skill? More than most bettors expect.
Picture a bettor with no skill at all who always bets at 2.00. The prices are fair, with no bookmaker margin. Over thousands of bets this bettor breaks even, but short samples swing a lot. We worked out the exact chances for this bettor at each number of bets:
| Bets logged | ROI in 95% of cases | Chance of +8% or better |
|---|---|---|
| 30 | −33% to +33% | 29% |
| 100 | −20% to +20% | 24% |
| 300 | −11% to +11% | 9% |
| 1,000 | −6% to +6% | 0.6% |
After 100 bets at 2.00, a bettor with no skill shows +8% ROI or better about one time in four.
Check your own numbers here:
Type how many bets you have logged, your average odds and your ROI. The checker shows how often a bettor with no skill at all gets the same result by luck.
Assumes fair prices with no bookmaker margin, so real luck does a little worse. Average odds stand in for mixed prices, which makes the result a close estimate. 18+.Numbers from your Summary sheet. Fair prices assumed. 18+.
Longer odds make the range even wider, because wins are bigger and come less often. A month of +15% on 40 bets is well inside what luck alone can produce. For your first few hundred bets, watch CLV instead, because it depends less on luck than profit does. At these prices, the luck range only drops to about ±11% after 300 bets. An 8% ROI at 2.00 needs about 420 bets before luck alone reaches it only about one time in twenty.
A five-minute check once a month
Open the Summary sheet once a month. Start with ROI without free bets, since that is your own result.
Next, look at the tables by bet type and by odds range. In the example log, singles made 40.75 on 145 staked, a ROI of 28.1%. But 26.25 of that is the Napoli free bet again. Without it, singles made 14.50, or 10%. The only accumulator lost its 10. Bets priced at 2.50 or higher lost money overall: −3.00 between 2.50 and 3.99, and −10.00 at 4.00 and up.
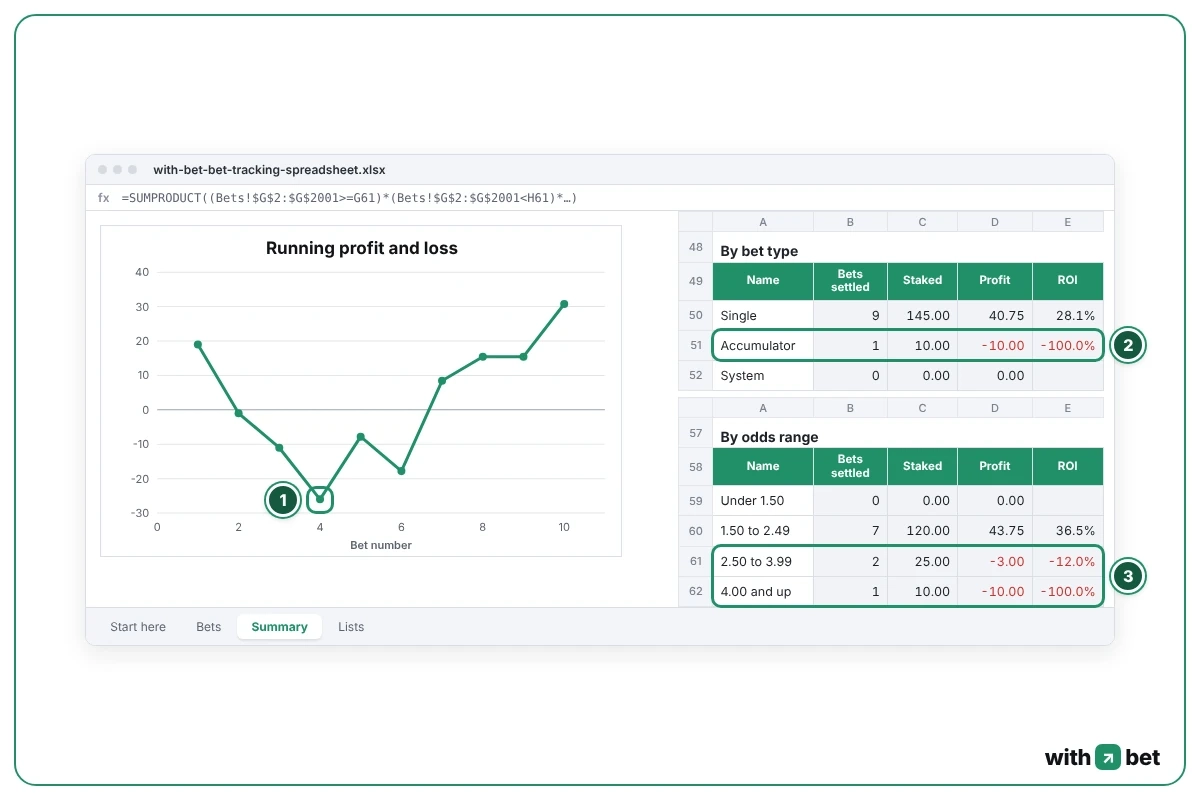
With ten bets these splits mean very little, as the luck table above shows. After a few hundred bets, the same tables point to the bet types and price ranges that make or lose your money.
Then check the chart. Has the line fallen for several weeks in a row? Lower your stake until it stops. Last, read the month table. Each calendar month gets its own profit and ROI, so a single big win counts toward one month only.
Bet tracking spreadsheet vs app
We tested two bet tracking apps hands-on, Zort and mybets.gg, both on their free plans. Both read a photo or a screenshot of the bet slip. That part is faster than typing. Zort read a two-leg accumulator printed at 7.61 as 7.74, so you still check every number.
In both apps, we picked won or lost ourselves.
In both apps we tested, every result was a button we pressed. One app let us book a win on a match that had not started yet.
That was mybets.gg. We marked a future match as won, and the dashboard showed the profit at once. A spreadsheet works the same way, but there you can click any cell and see the formula behind it.
| What you compare | Spreadsheet | Zort and mybets.gg, free plans |
|---|---|---|
| Logging a bet | Type 8 fields, set P | Photo of the slip, then check the fields |
| Setting the result | You choose it | You choose it |
| ROI | Shown, also without free bets | Zort: locked. mybets.gg: two screens disagree |
| Export | The file is already yours | Zort: not built yet. mybets.gg: CSV on a paid plan |
| On a phone | Slow | Fast |
Our bet tracker guide explains the four ways to get a bet into a betting log or betting journal.
If the template does not work
Odds are rejected. Your Excel most likely uses a decimal comma. Type 1,95 instead of 1.95.
Profit stays empty. Profit appears only when Odds, Stake and Result are all filled in and Result is not P.
A cash-out shows as a full loss. Cash-out return is empty, so the sheet counts it as 0. Type the amount the bookmaker paid you.
A date shows as a number like 46270. The cell lost its date format. Select the Date column and set the format to Date.
A row lost its formulas. In Excel and LibreOffice the grey cells are protected, but protection can be turned off without a password. In Google Sheets there is no lock at all. If formulas went missing, copy the grey cells N to Q from a row further down and paste them into the same columns of the broken row.
A bet is missing from the month table. The Date cell is empty. Type the date, and the bet joins its month.
A drop-down menu is missing in Google Sheets. If you imported the .xlsx, open our Google Sheets version with examples or the blank one and use Make a copy instead.
The chart is empty. It shows settled bets only. Pending bets and empty rows never appear on it.
When a spreadsheet is not enough
The sheet adds up numbers without knowing the currency. Keep one file per currency.
A system bet goes in as one row. Type its total stake, set Result to CO and put the total return in Cash-out return. Profit then works for any outcome, even a partial loss. Like a cash-out, the system bet stays out of the win rate.
The template has 2,000 rows ready, and every total on the Summary sheet counts all of them. And a betting tracker spreadsheet will never settle a bet for you. In the two apps we tested, the result was manual too.
Frequently asked questions
Can I use the bet tracking spreadsheet on my phone?
How do I track bets in two currencies?
Should I track bets in units or in money?
Can I move my history from a bet tracker app?